The best Business Suite software in India, built to help your business grow. Contact us at +91-8882435276.
[ Contact ]
Phone number
Email address
Head office
Noida office
The right team at TriostackOne will get back to you.
Find out where tickets come from, how fast you answer, where backlog builds and which topics keep repeating, then act on it.
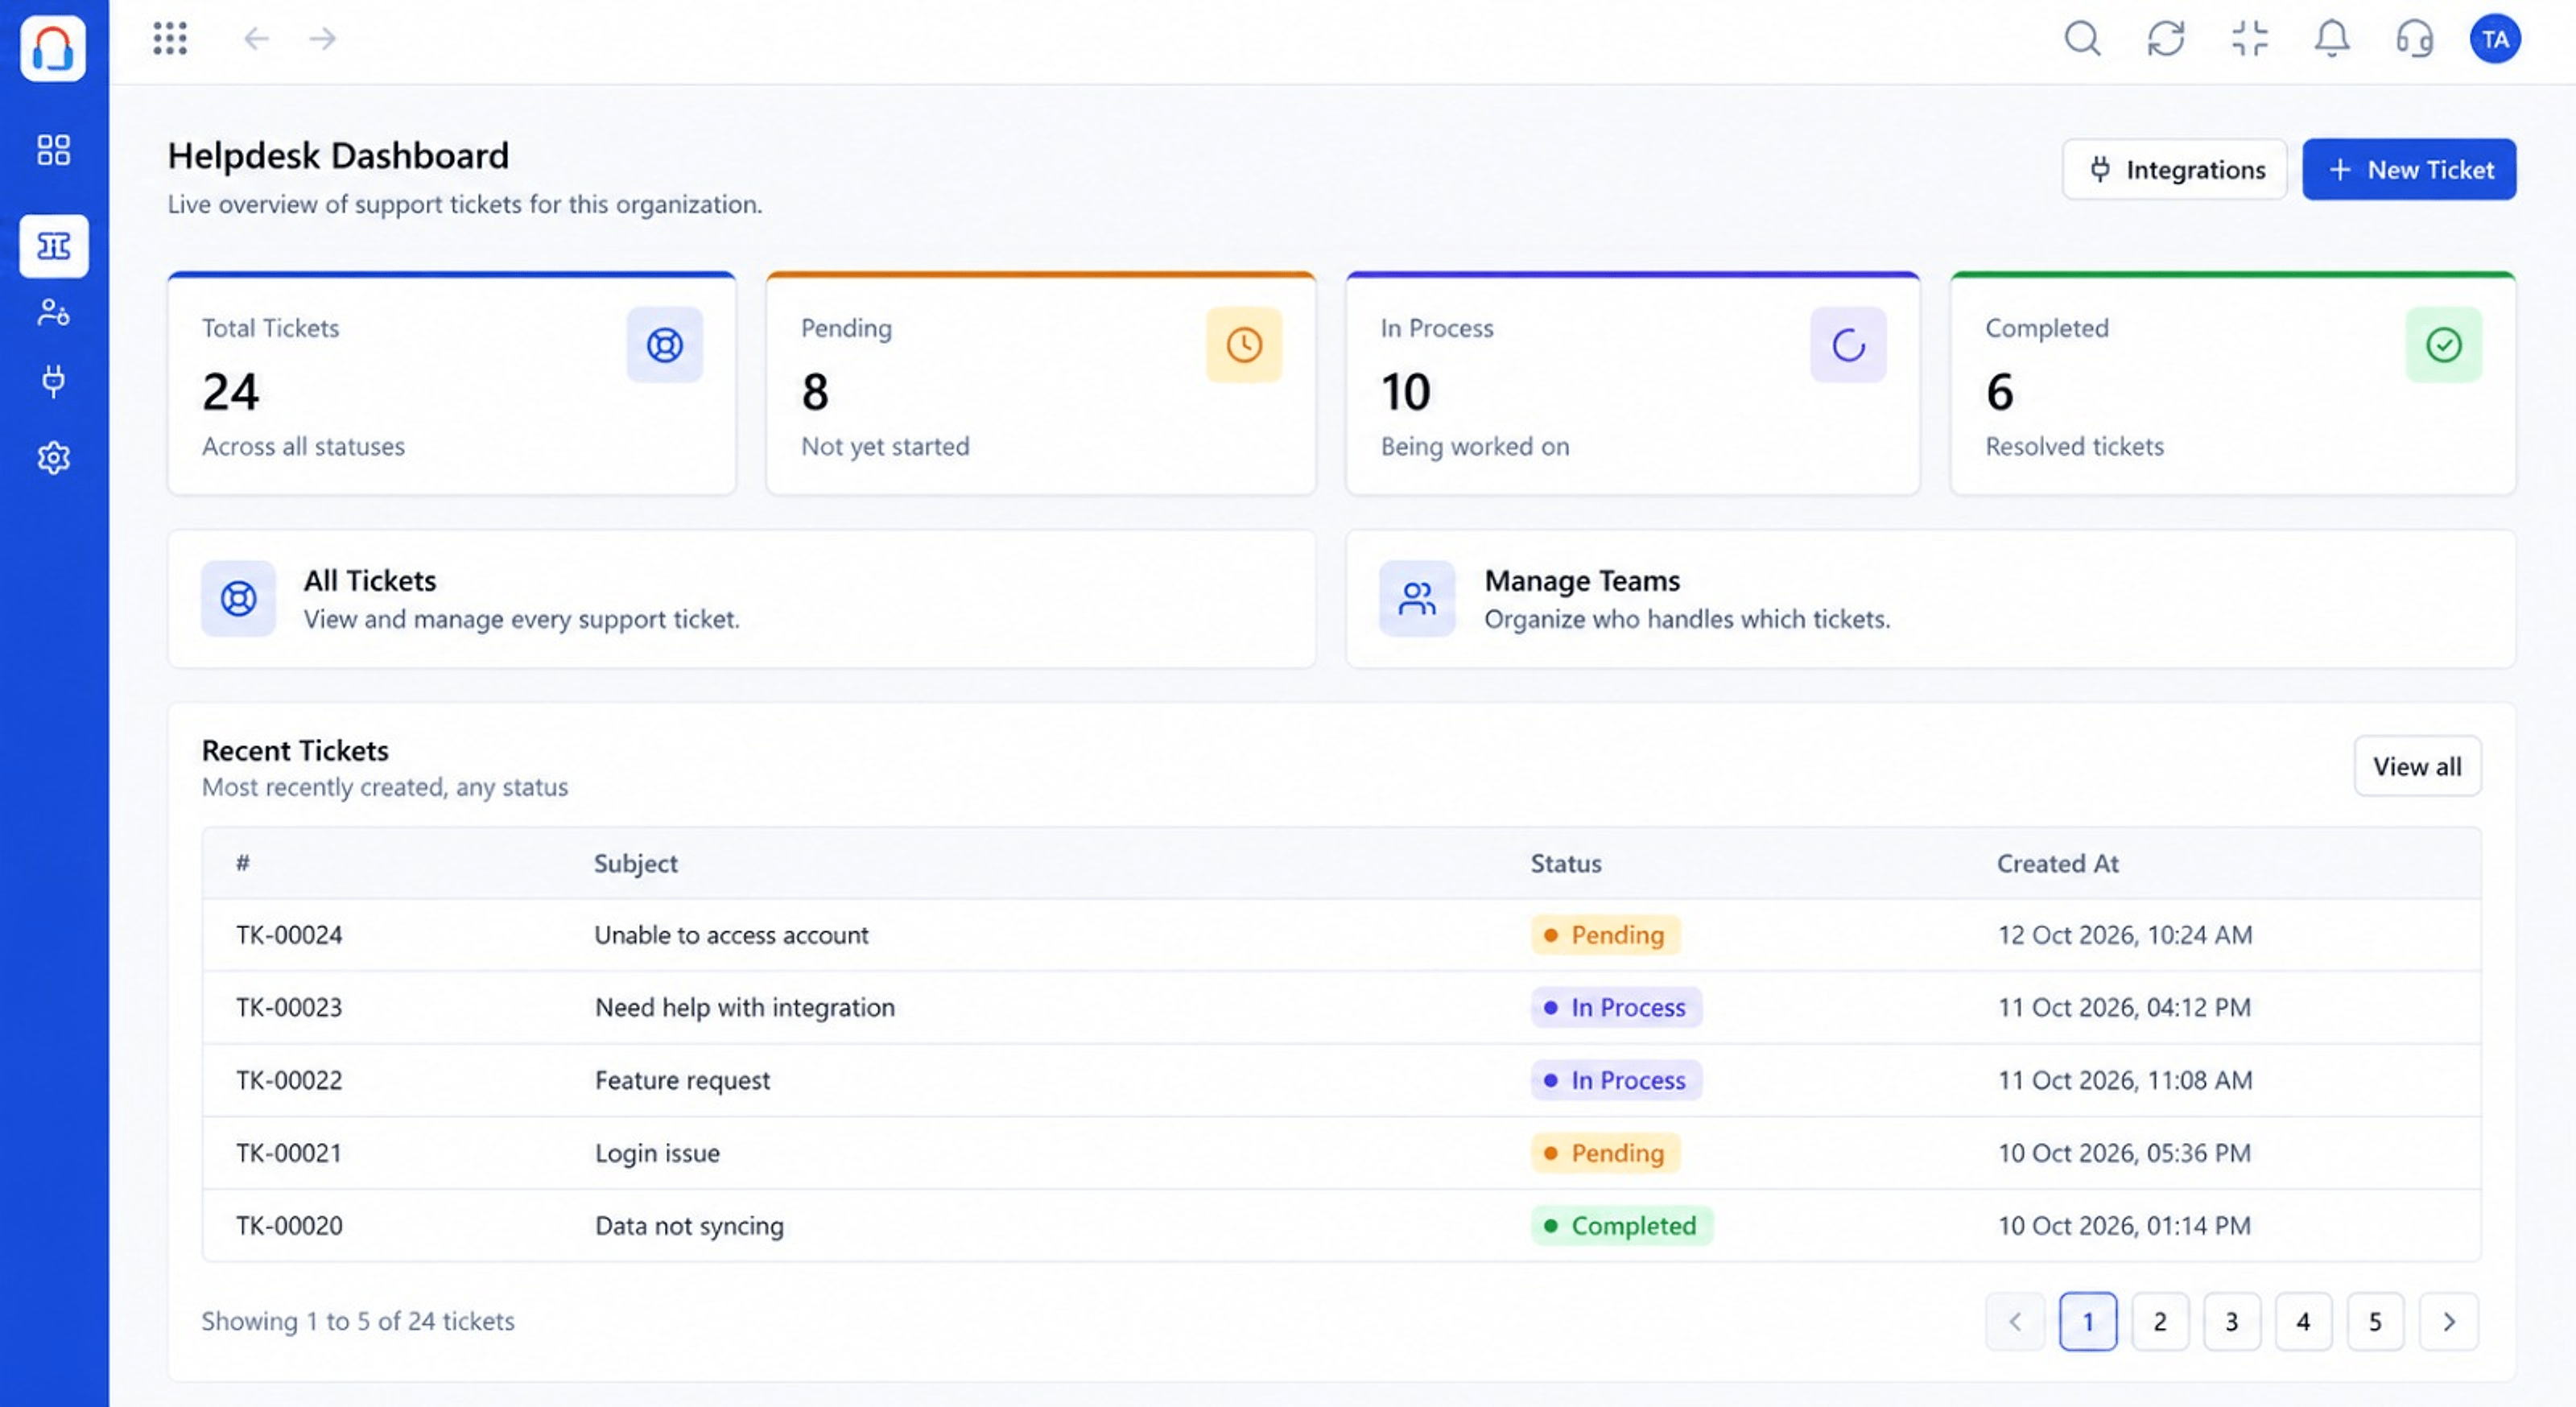
From raw tickets to clear next steps
Positioning Assessment
Support sees problems before anyone else, but without analysis those signals stay in the queue.
Desk reports show volume, speed, backlog and topics, so leaders can staff correctly, coach effectively and tell product teams what customers struggle with.
“The repeated-topics report gave the product team a ranked list of what confuses customers.”
Sample team scenario
Illustrative example, not a customer testimonial
Illustrated Overview
Imagine zooming out from single tickets until patterns appear: which topics repeat, where time is lost, when demand peaks.
Trends beat single tickets.
Topics reveal root issues.
Measure before and after.
Platform Integrity
Volume over time
Response and resolution
Where tickets wait
What repeats
How It Works
What reports reveal.
| Dimension | Triostack Desk | Guesswork |
|---|---|---|
| Demand | Volume by channel and time | Impressions |
| Speed | Measured | Felt |
| Backlog | Ageing visible | Hidden |
| Topics | Ranked repeat issues | Anecdotes |
| Planning | Evidence-based | Opinion-based |
We will help you configure this workflow end to end, from queues to permissions, in your first session.
Live Interface Tour
Real screens captured directly from the Triostack Desk workspace.
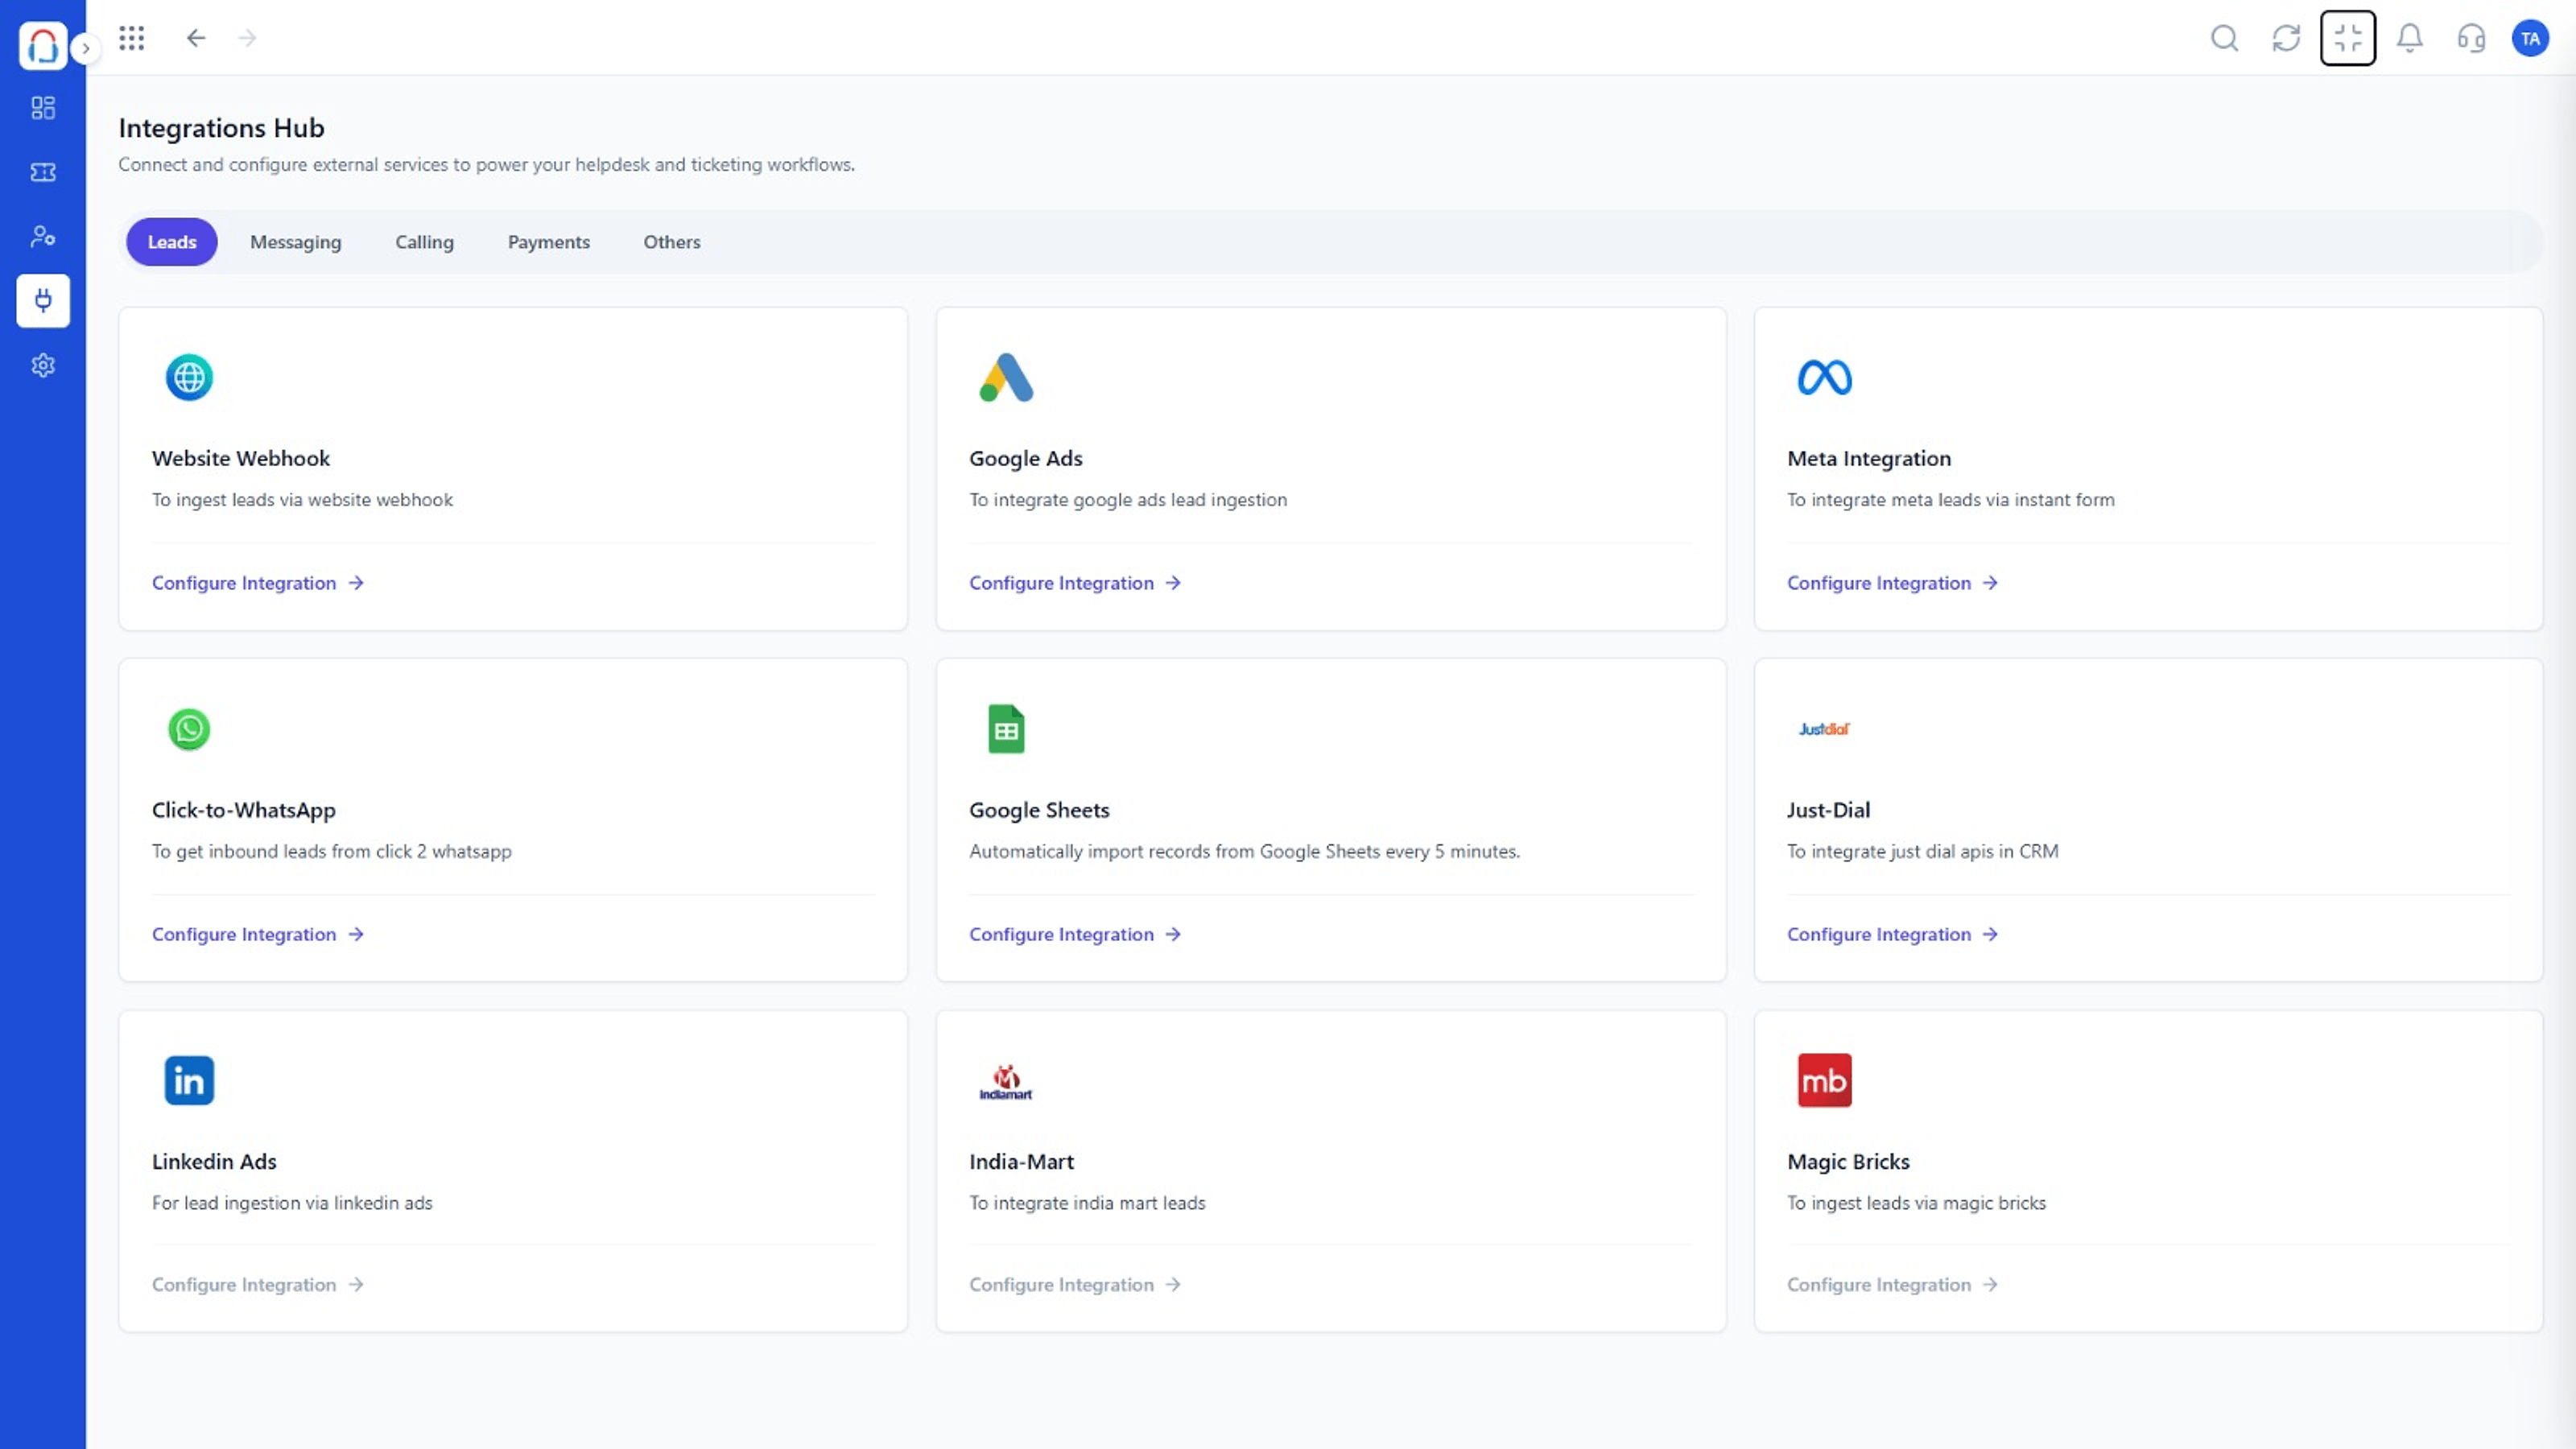 Integrations
Connect channels and tools to your helpdesk
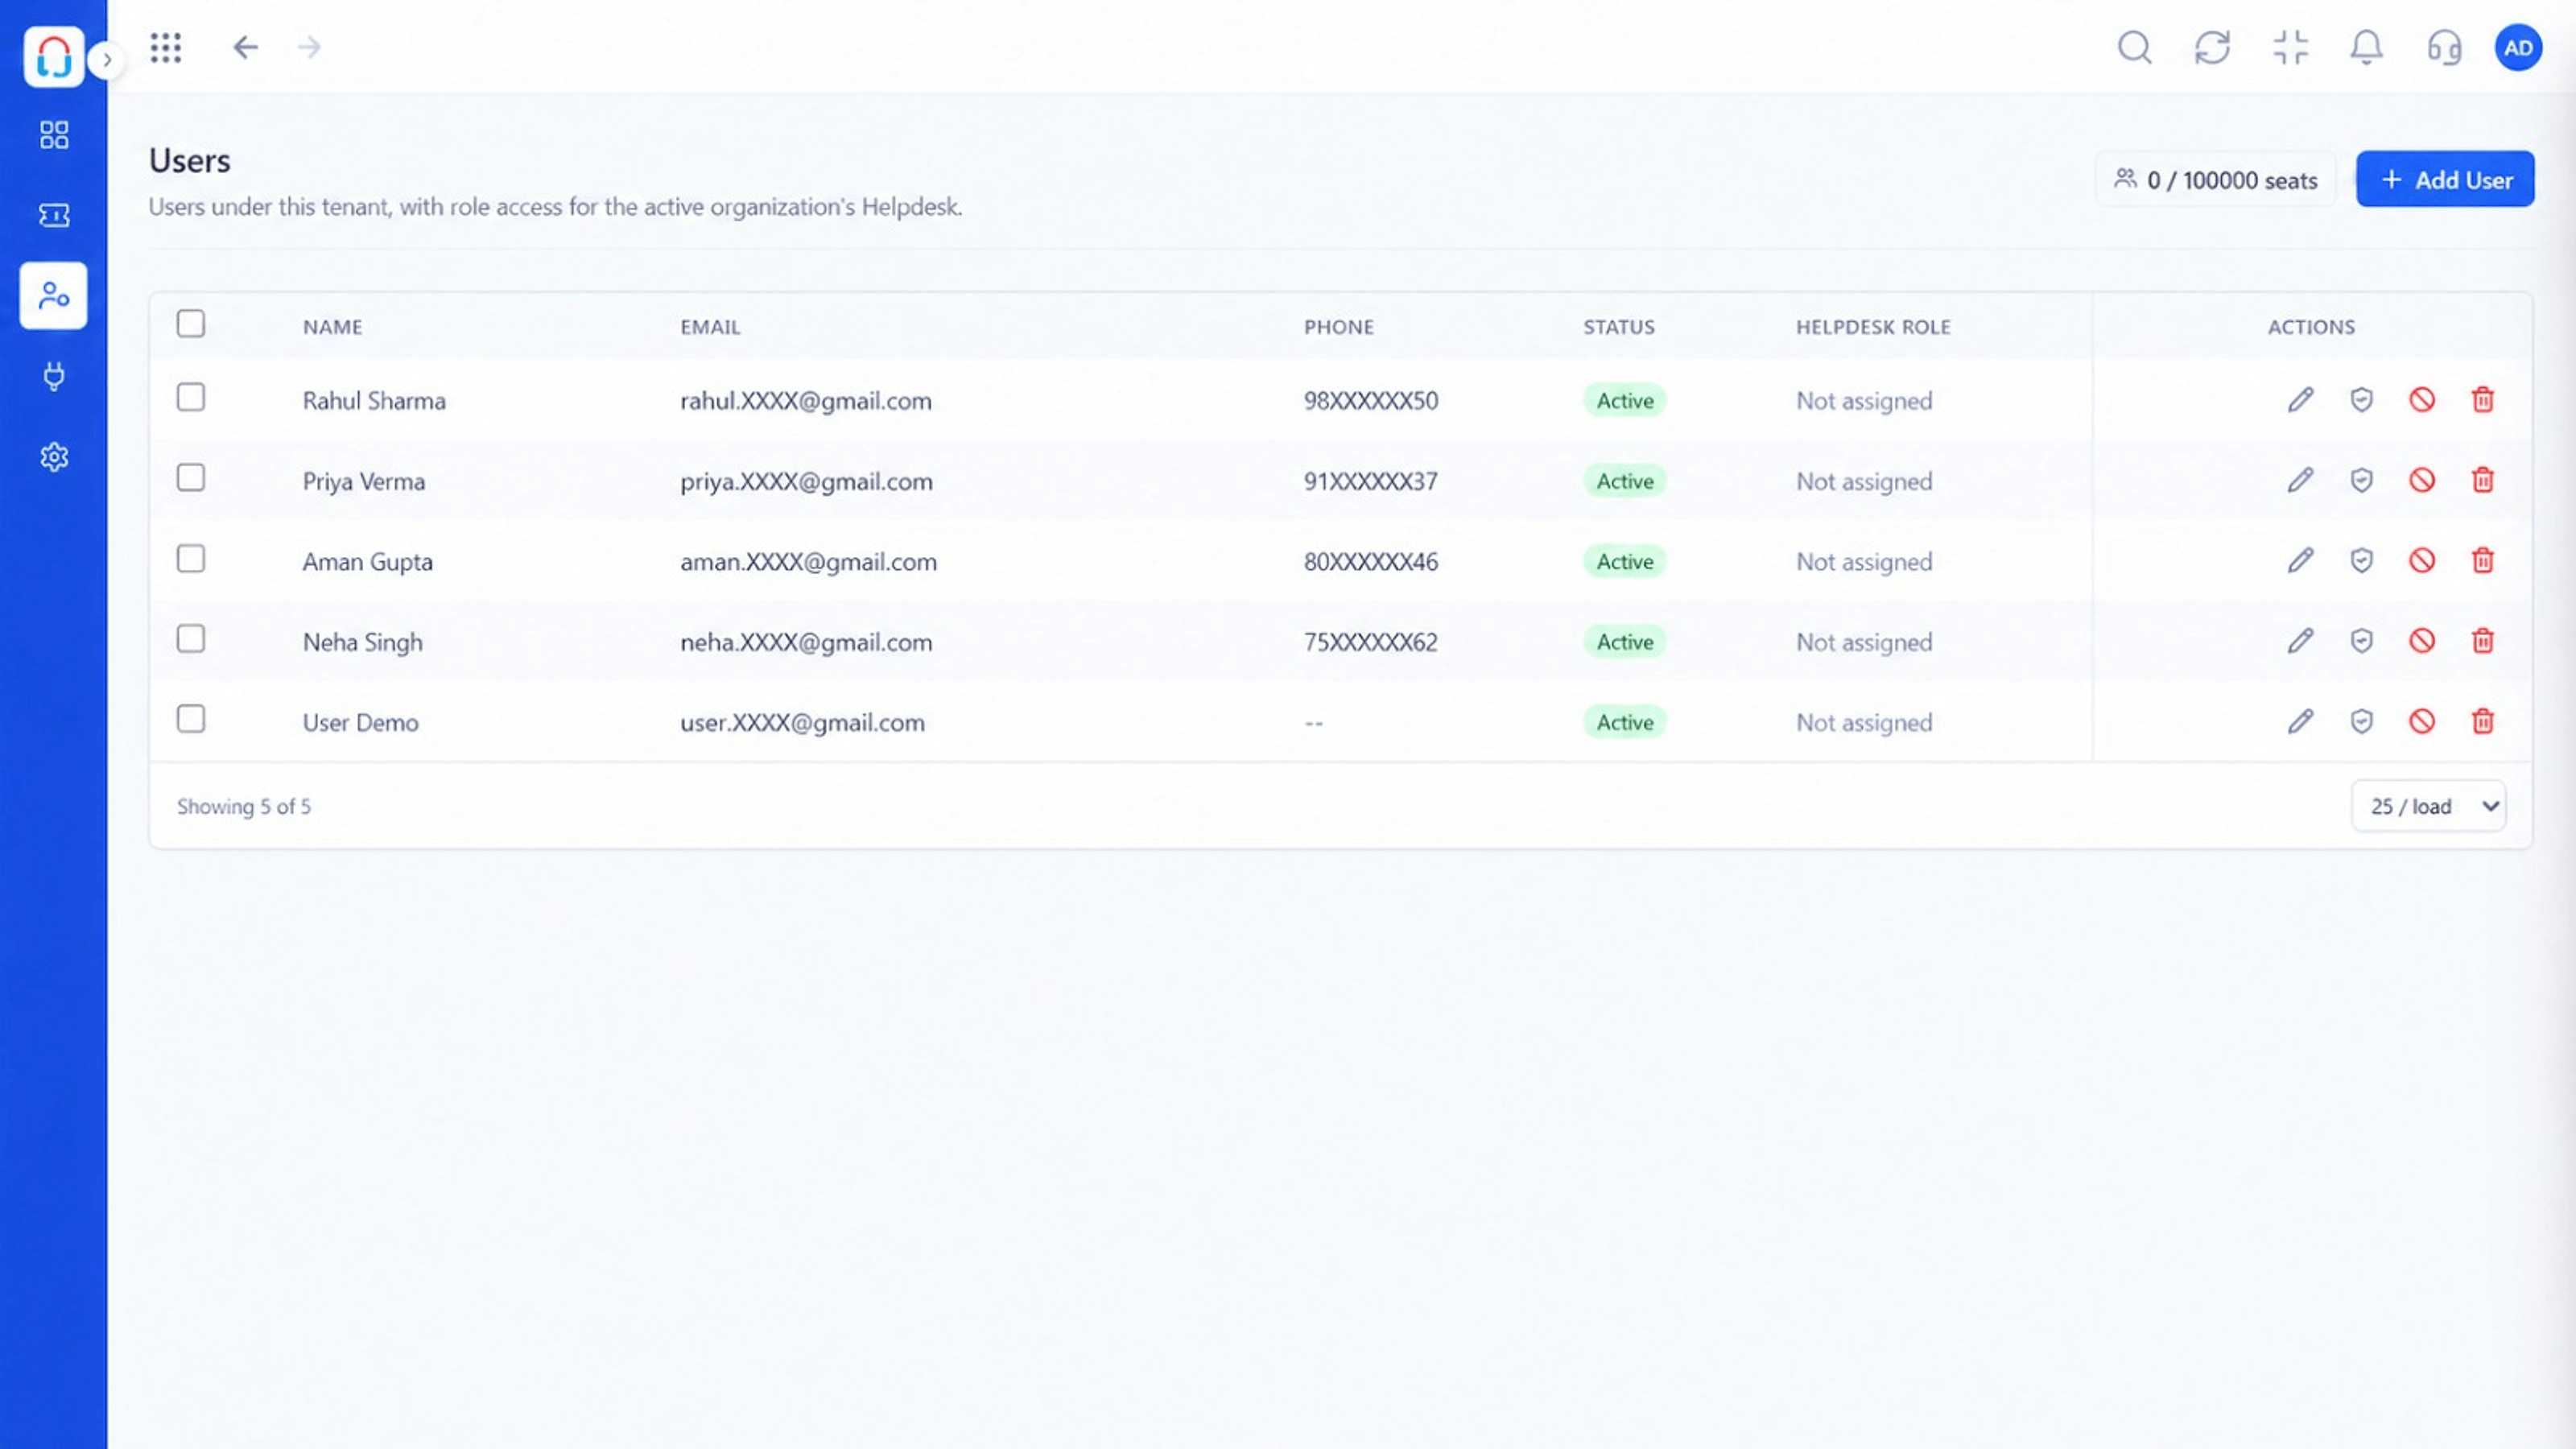 Team
Agents, teams and roles in one place
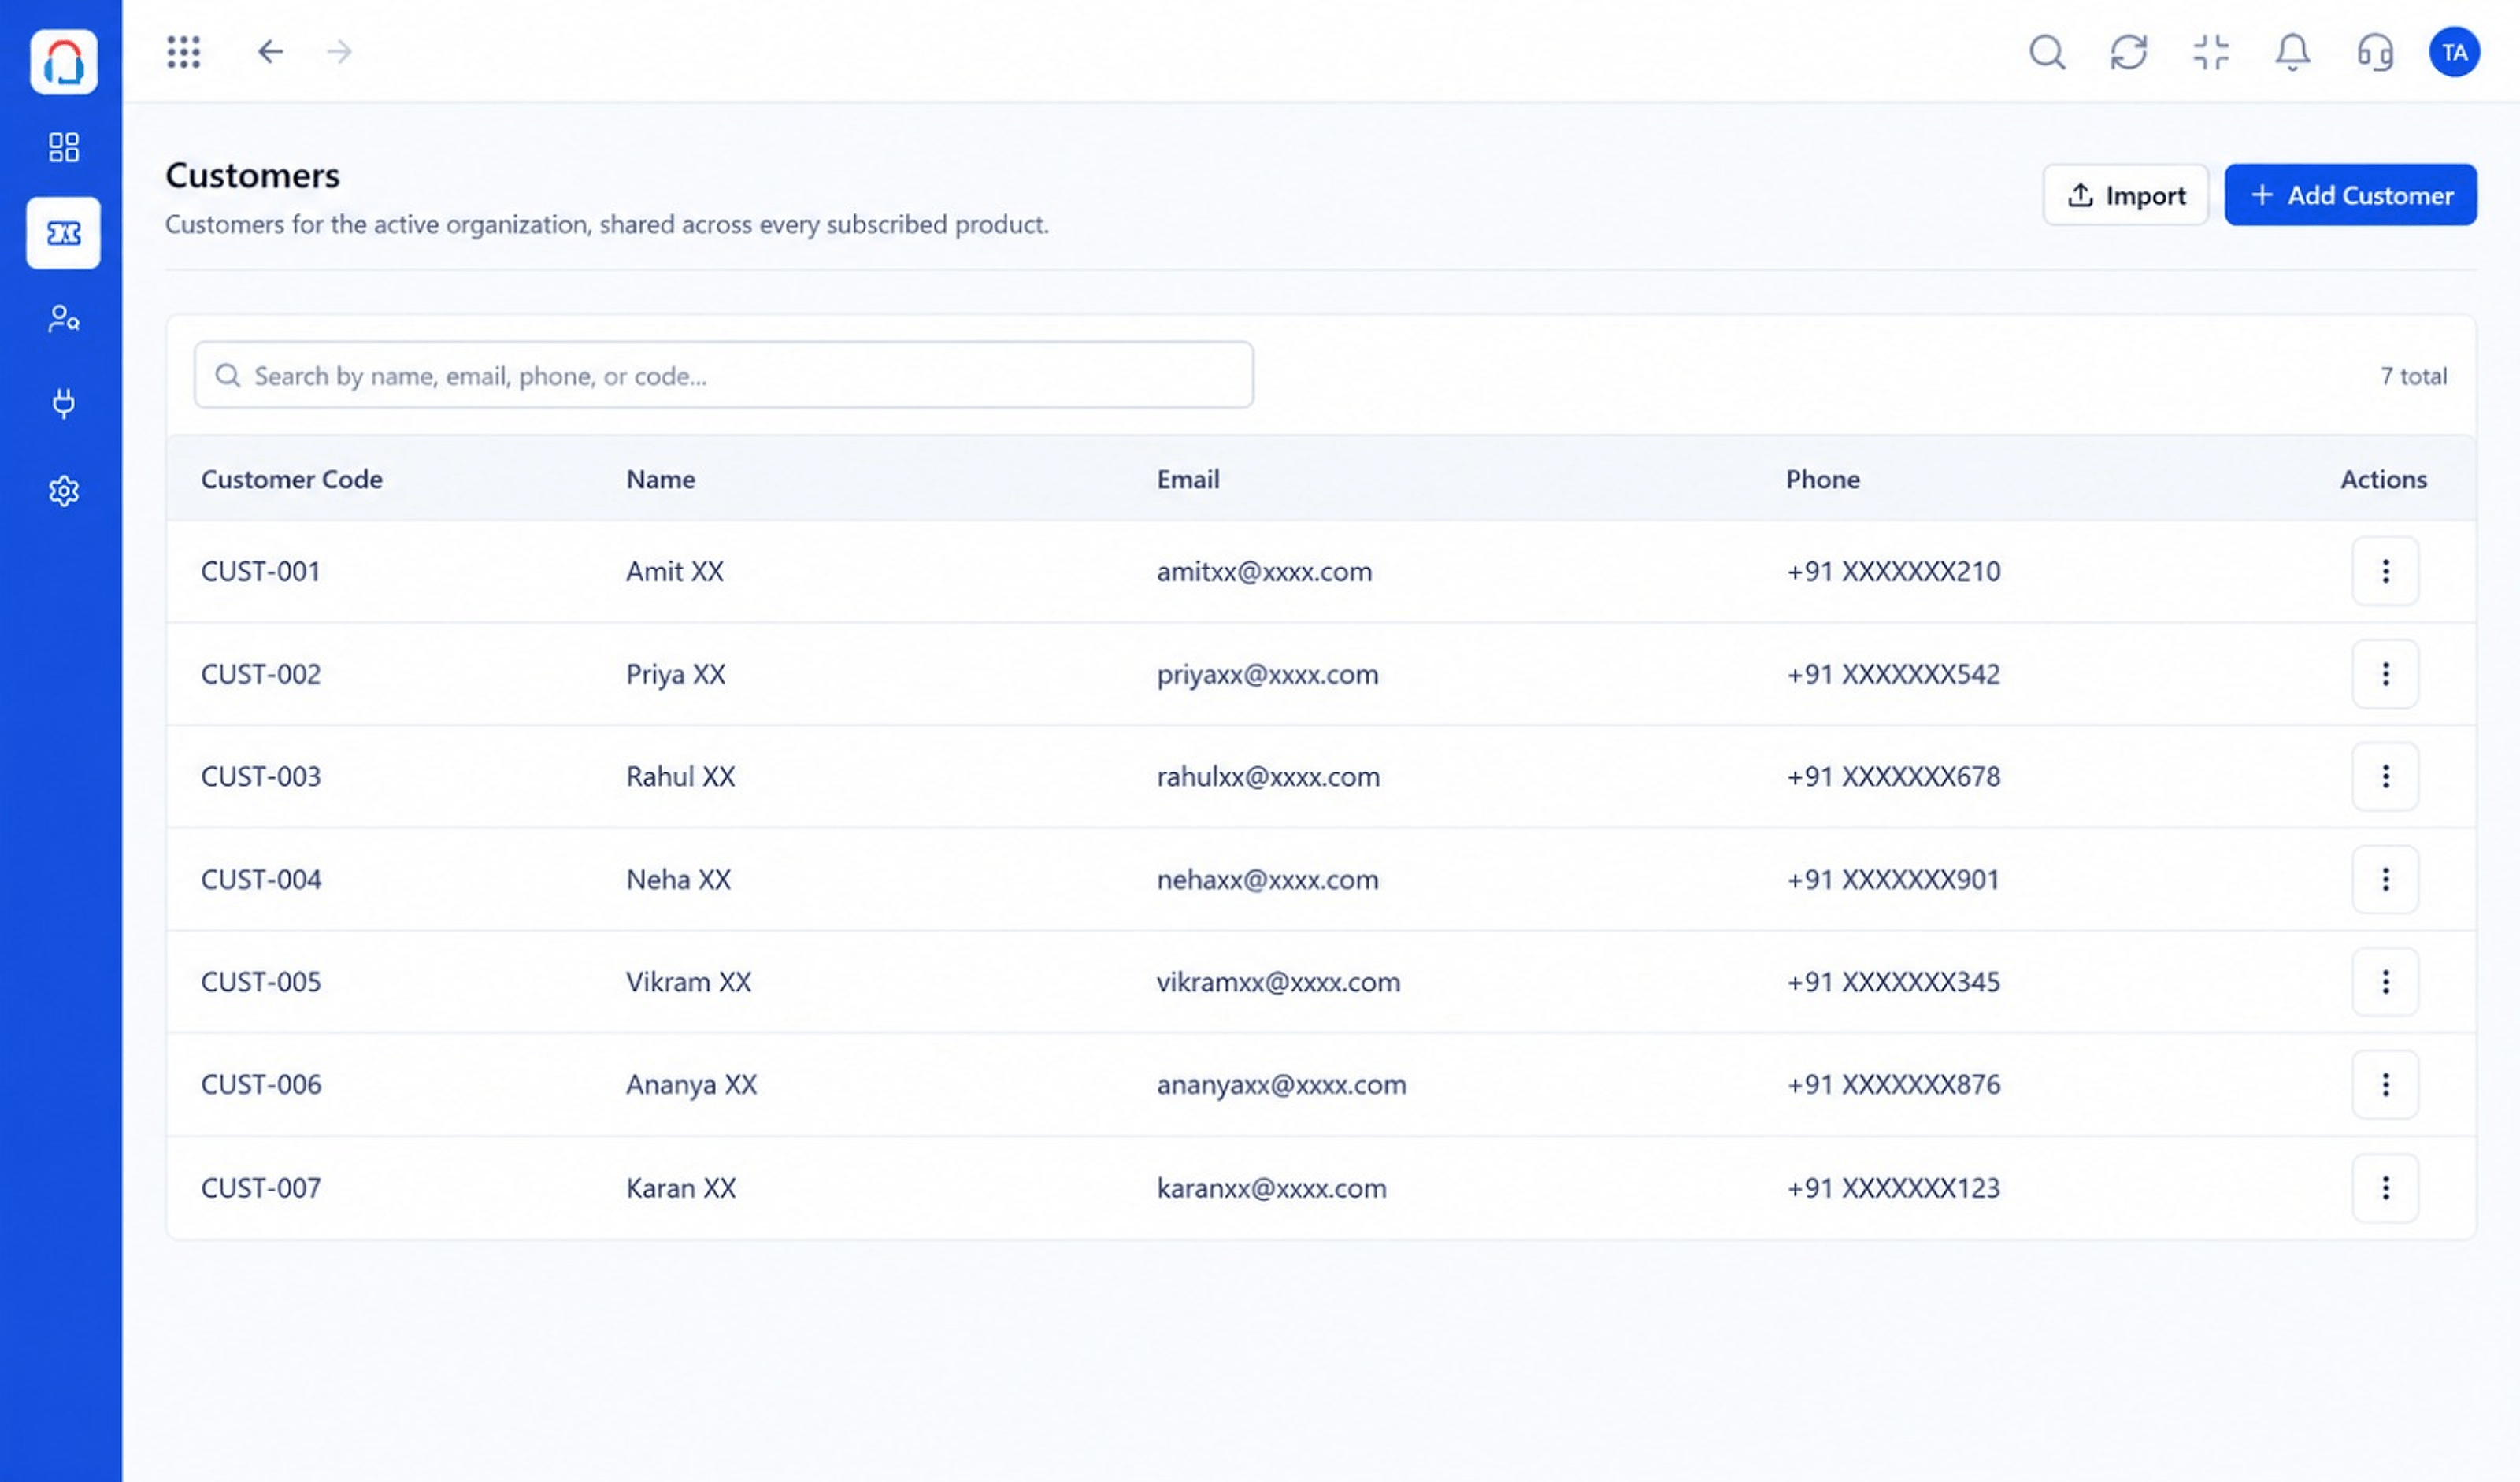 Customers
Every customer with their full ticket history
Feature Breakdown
Captured from the Triostack Desk workspace.
What You Can DoHeadline numbers.
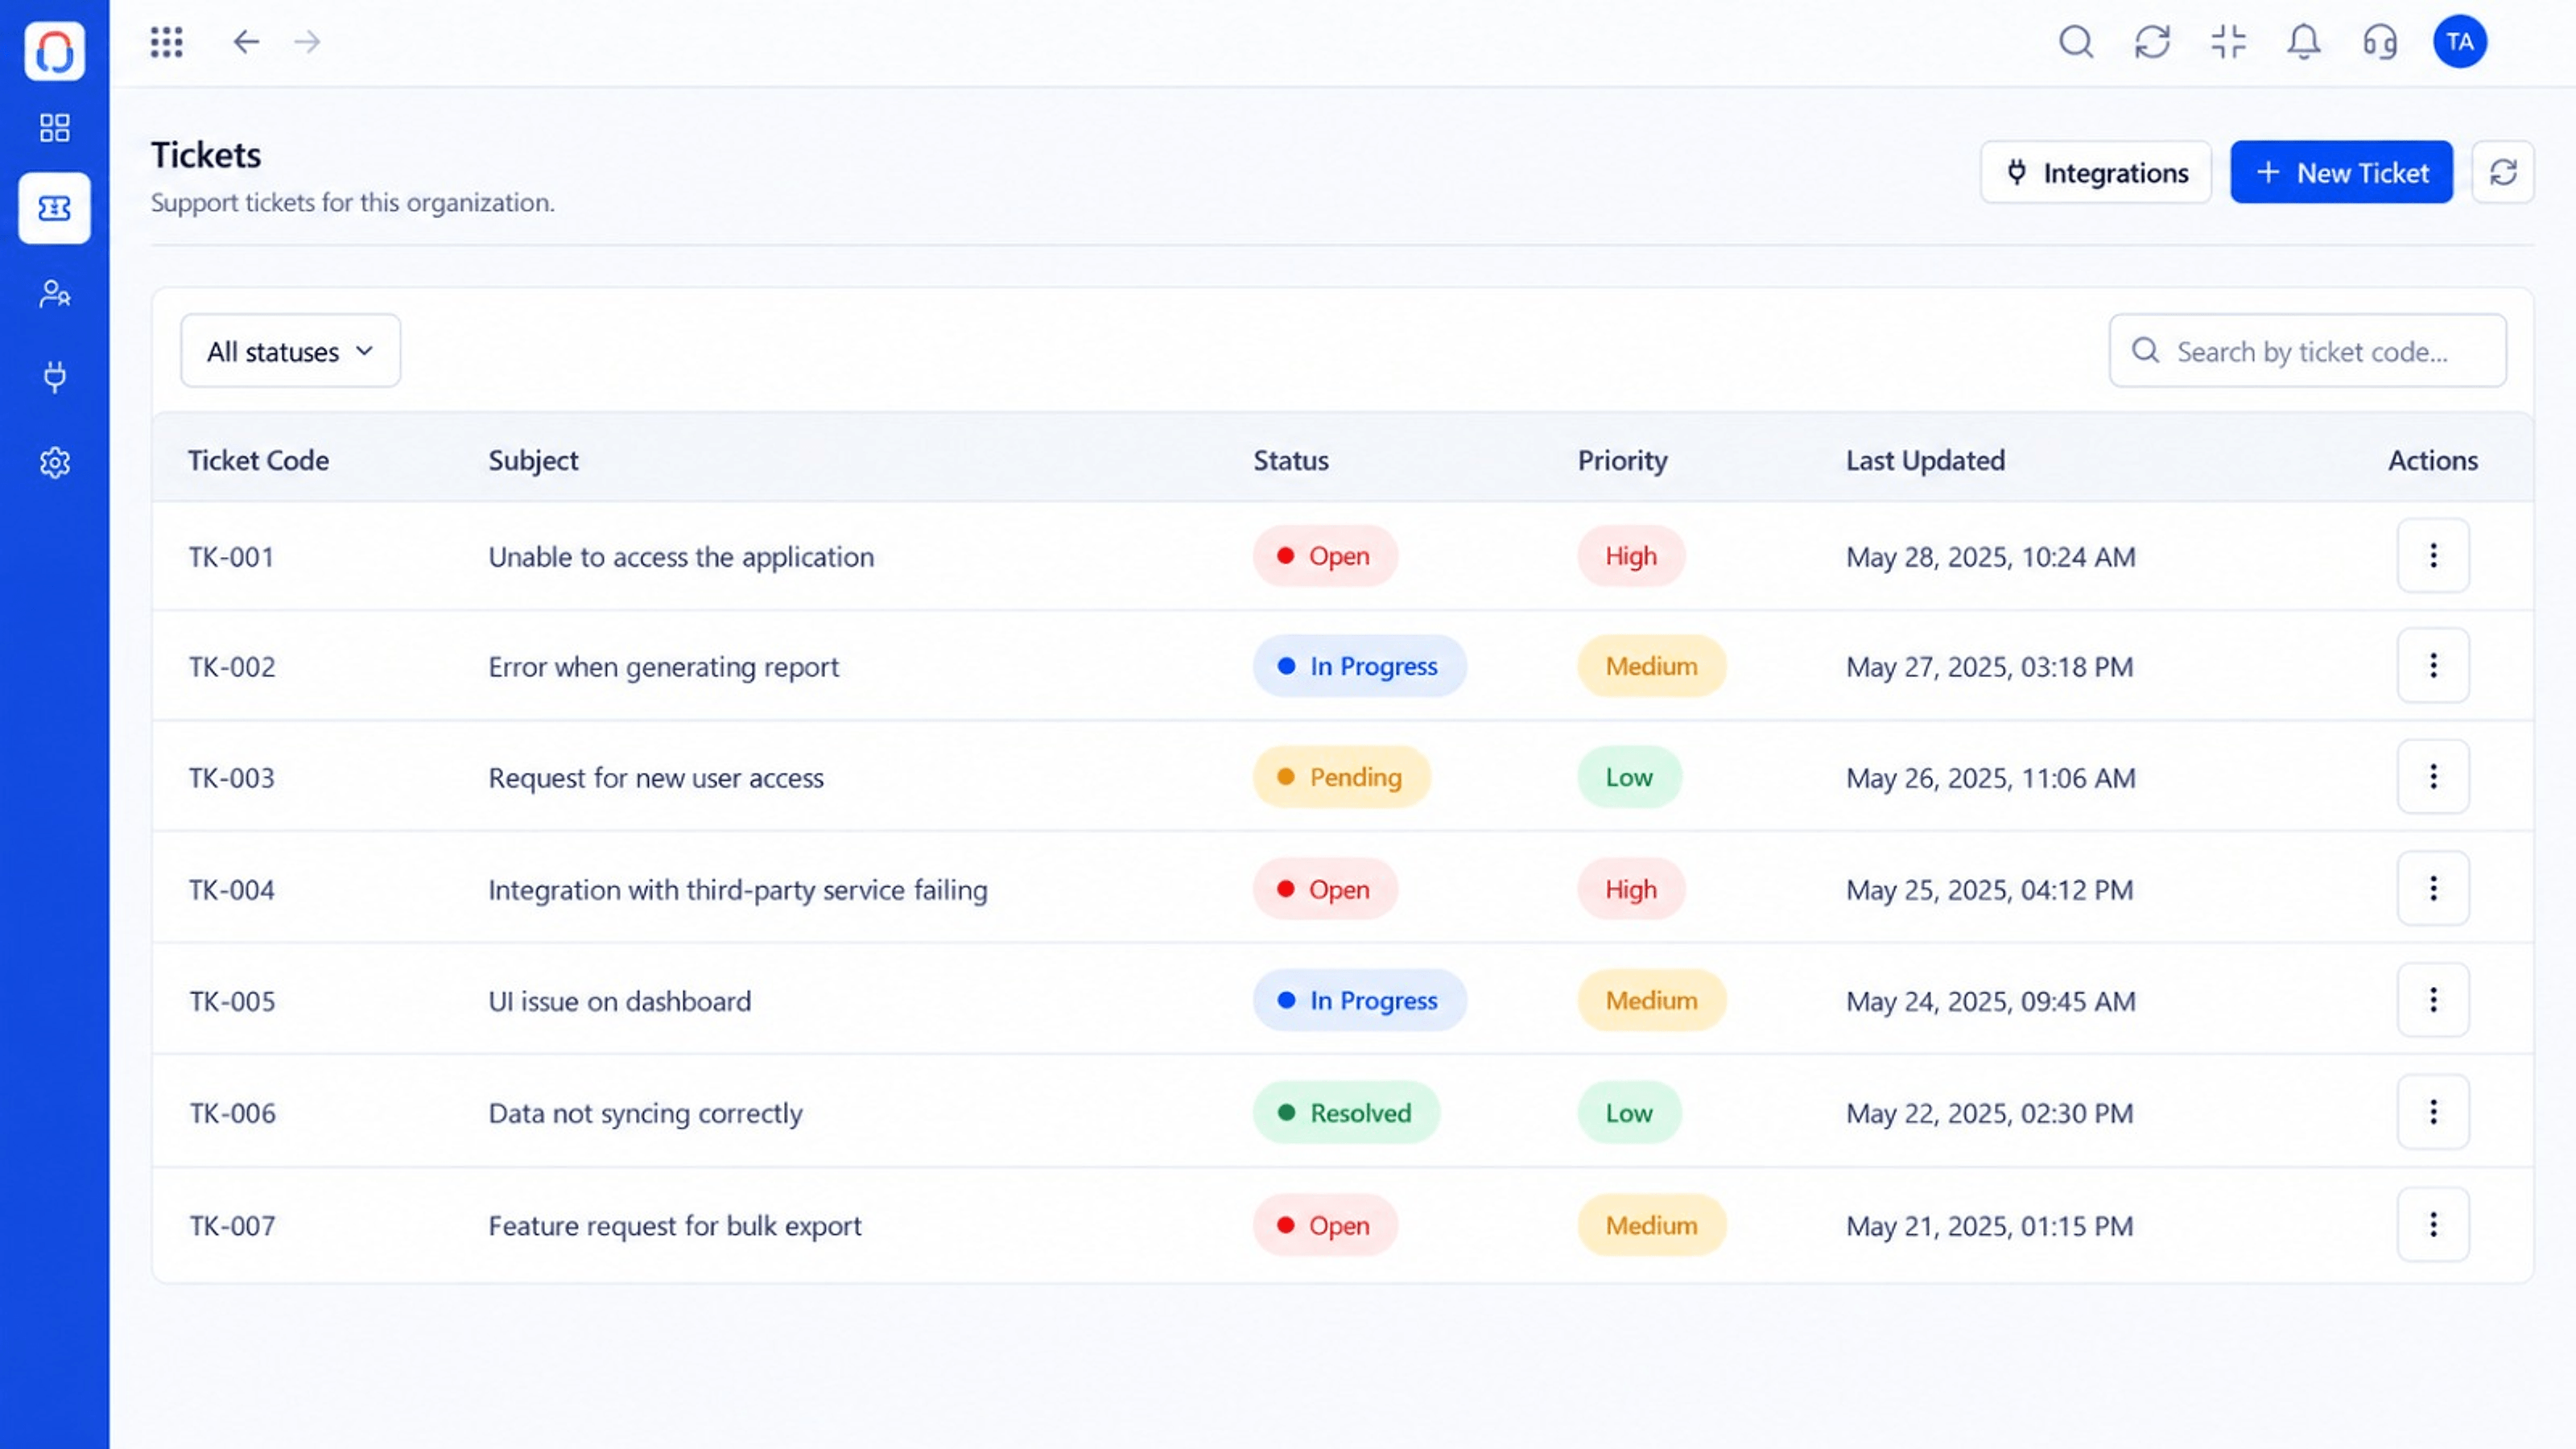 What You Can Do
What is waiting.
What You Can DoWorkload and outcomes.
What You Can DoWho needs most help.
Execution Plan
Open the dashboard for the period.
Look at topics, backlog and speed.
Staffing, articles or product fixes.
Measure the effect next month.
In Real Life
Scenario 01
Data shows when demand outruns capacity.
Scenario 02
Top topics go to the product team.
Scenario 03
Workload and outcomes guide one-to-ones.
Frequently Asked Questions
Volume, speed, backlog, workload and topics, filtered by team, channel and period.
Yes.
Subject to role permissions.
Ask about export options for your plan.
Tickets, shared inbox, automation, SLAs, knowledge base and reports, built for support teams of every size.
