The best Business Suite software in India, built to help your business grow. Contact us at +91-8882435276.
[ Contact ]
Phone number
Email address
Head office
Noida office
The right team at TriostackOne will get back to you.
Positioning Assessment
Many sites report visits and stop there, so teams cannot tell which pages feed the pipeline.
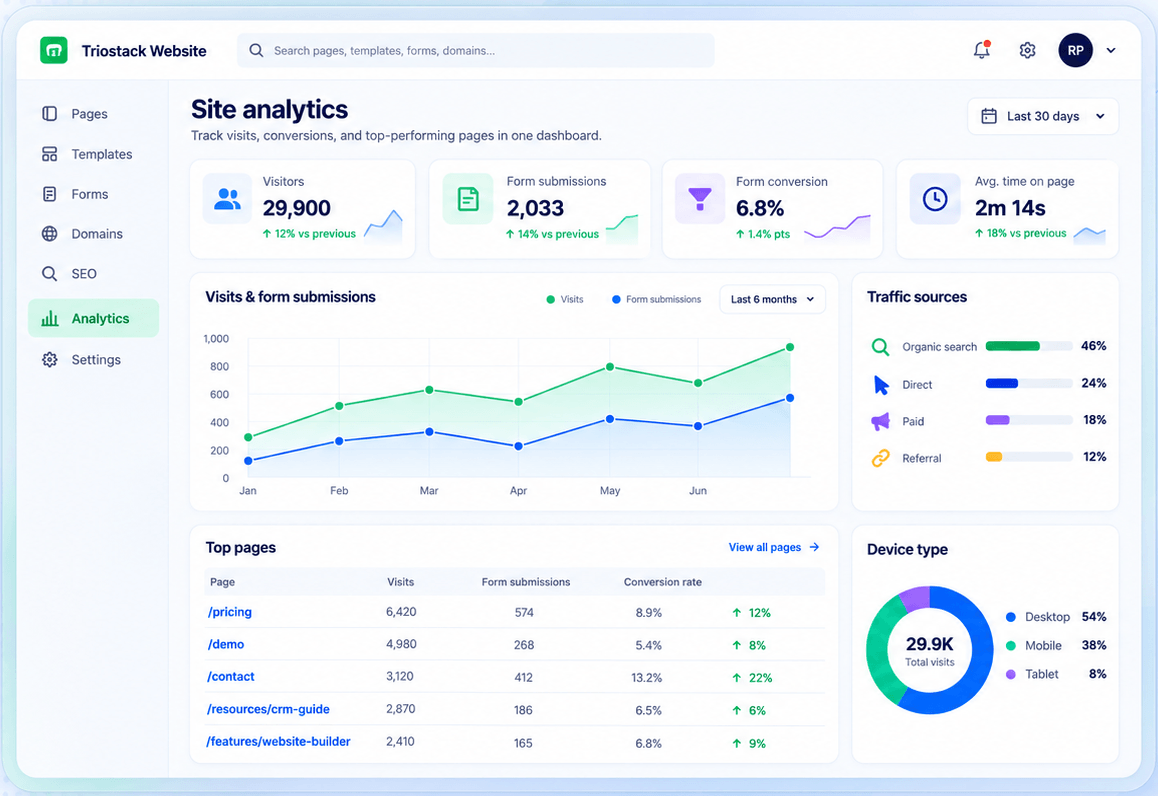
The Triostack Website analytics dashboard shows visitors, form submissions, form conversion and average time on page, a visits and submissions trend, traffic by source and device type, and your top pages ranked by visits, submissions and conversion rate.
“One ranking told us which three pages produced most of our leads.”
Sample team scenario
Illustrative example, not a customer testimonial
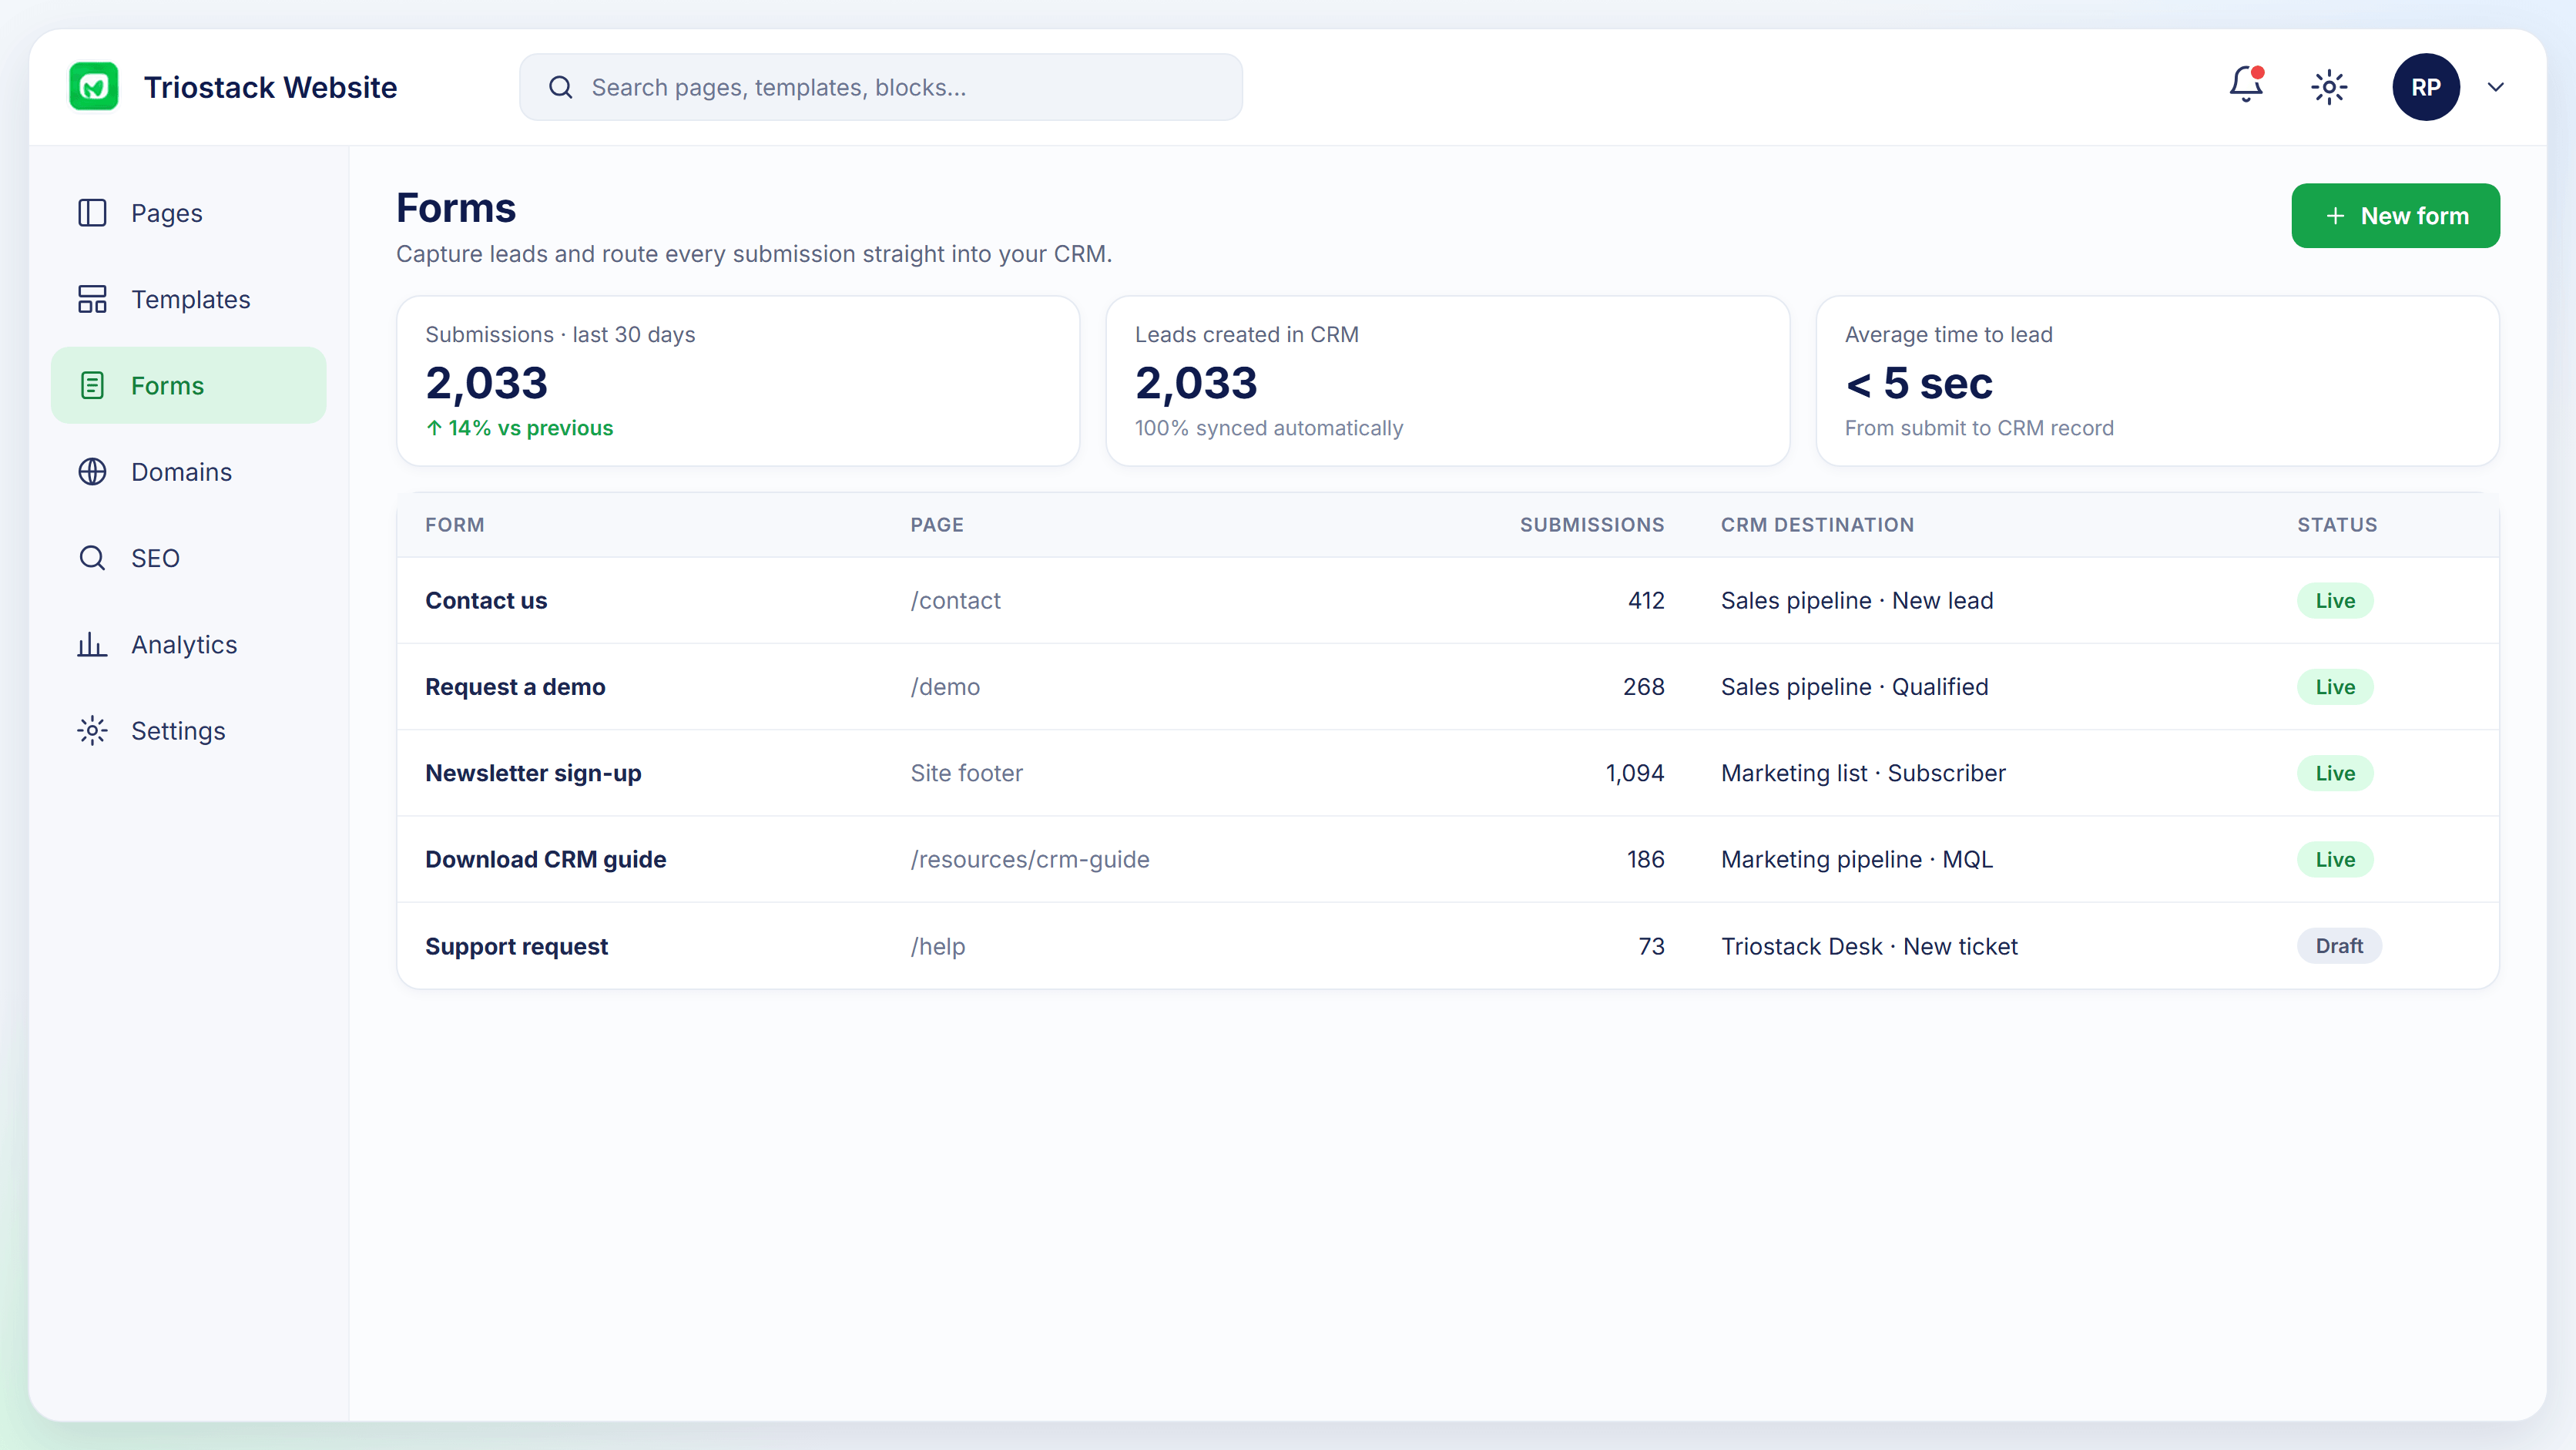
Forms
Submissions, leads created and conversion by form
In the Product
Imagine each page wearing a number for how many people came and how many said hello.
Leads in the same view.
Top pages ranked.
Sources and devices.
Platform Integrity
Over time
And conversion
Where they come from
Ranked by results
How It Works
What changes when analytics sees the forms.
| Dimension | Triostack Website | Traffic Counters |
|---|---|---|
| Visitors | Trend over time | A count |
| Leads | Submissions and conversion | Not tracked |
| Sources | By source and device | Basic |
| Pages | Ranked by conversion | Ranked by visits |
| Setup | Built in | Add a tag |
Book a walkthrough and we will set up a sandbox with a sample site so you can try the editor, forms and SEO tools before you commit.
Live Interface Tour
Real screens captured directly from the Triostack Website workspace.
Site Analytics
Traffic and leads side by side
Feature Breakdown
Captured from the Triostack Website workspace.
The dashboard.
How it fits the plan
Open. See the headline numbers.
Compare. Look at sources and devices.
Practical tip
Look at conversion, not just visits. A smaller page that converts beats a popular one that does not.
Per-form results.
On this screen: Submissions, leads created and conversion by form.
How it fits the plan
Compare. Look at sources and devices.
Rank. Find your top pages.
In real life
Budget decision
Spend goes where leads come from.
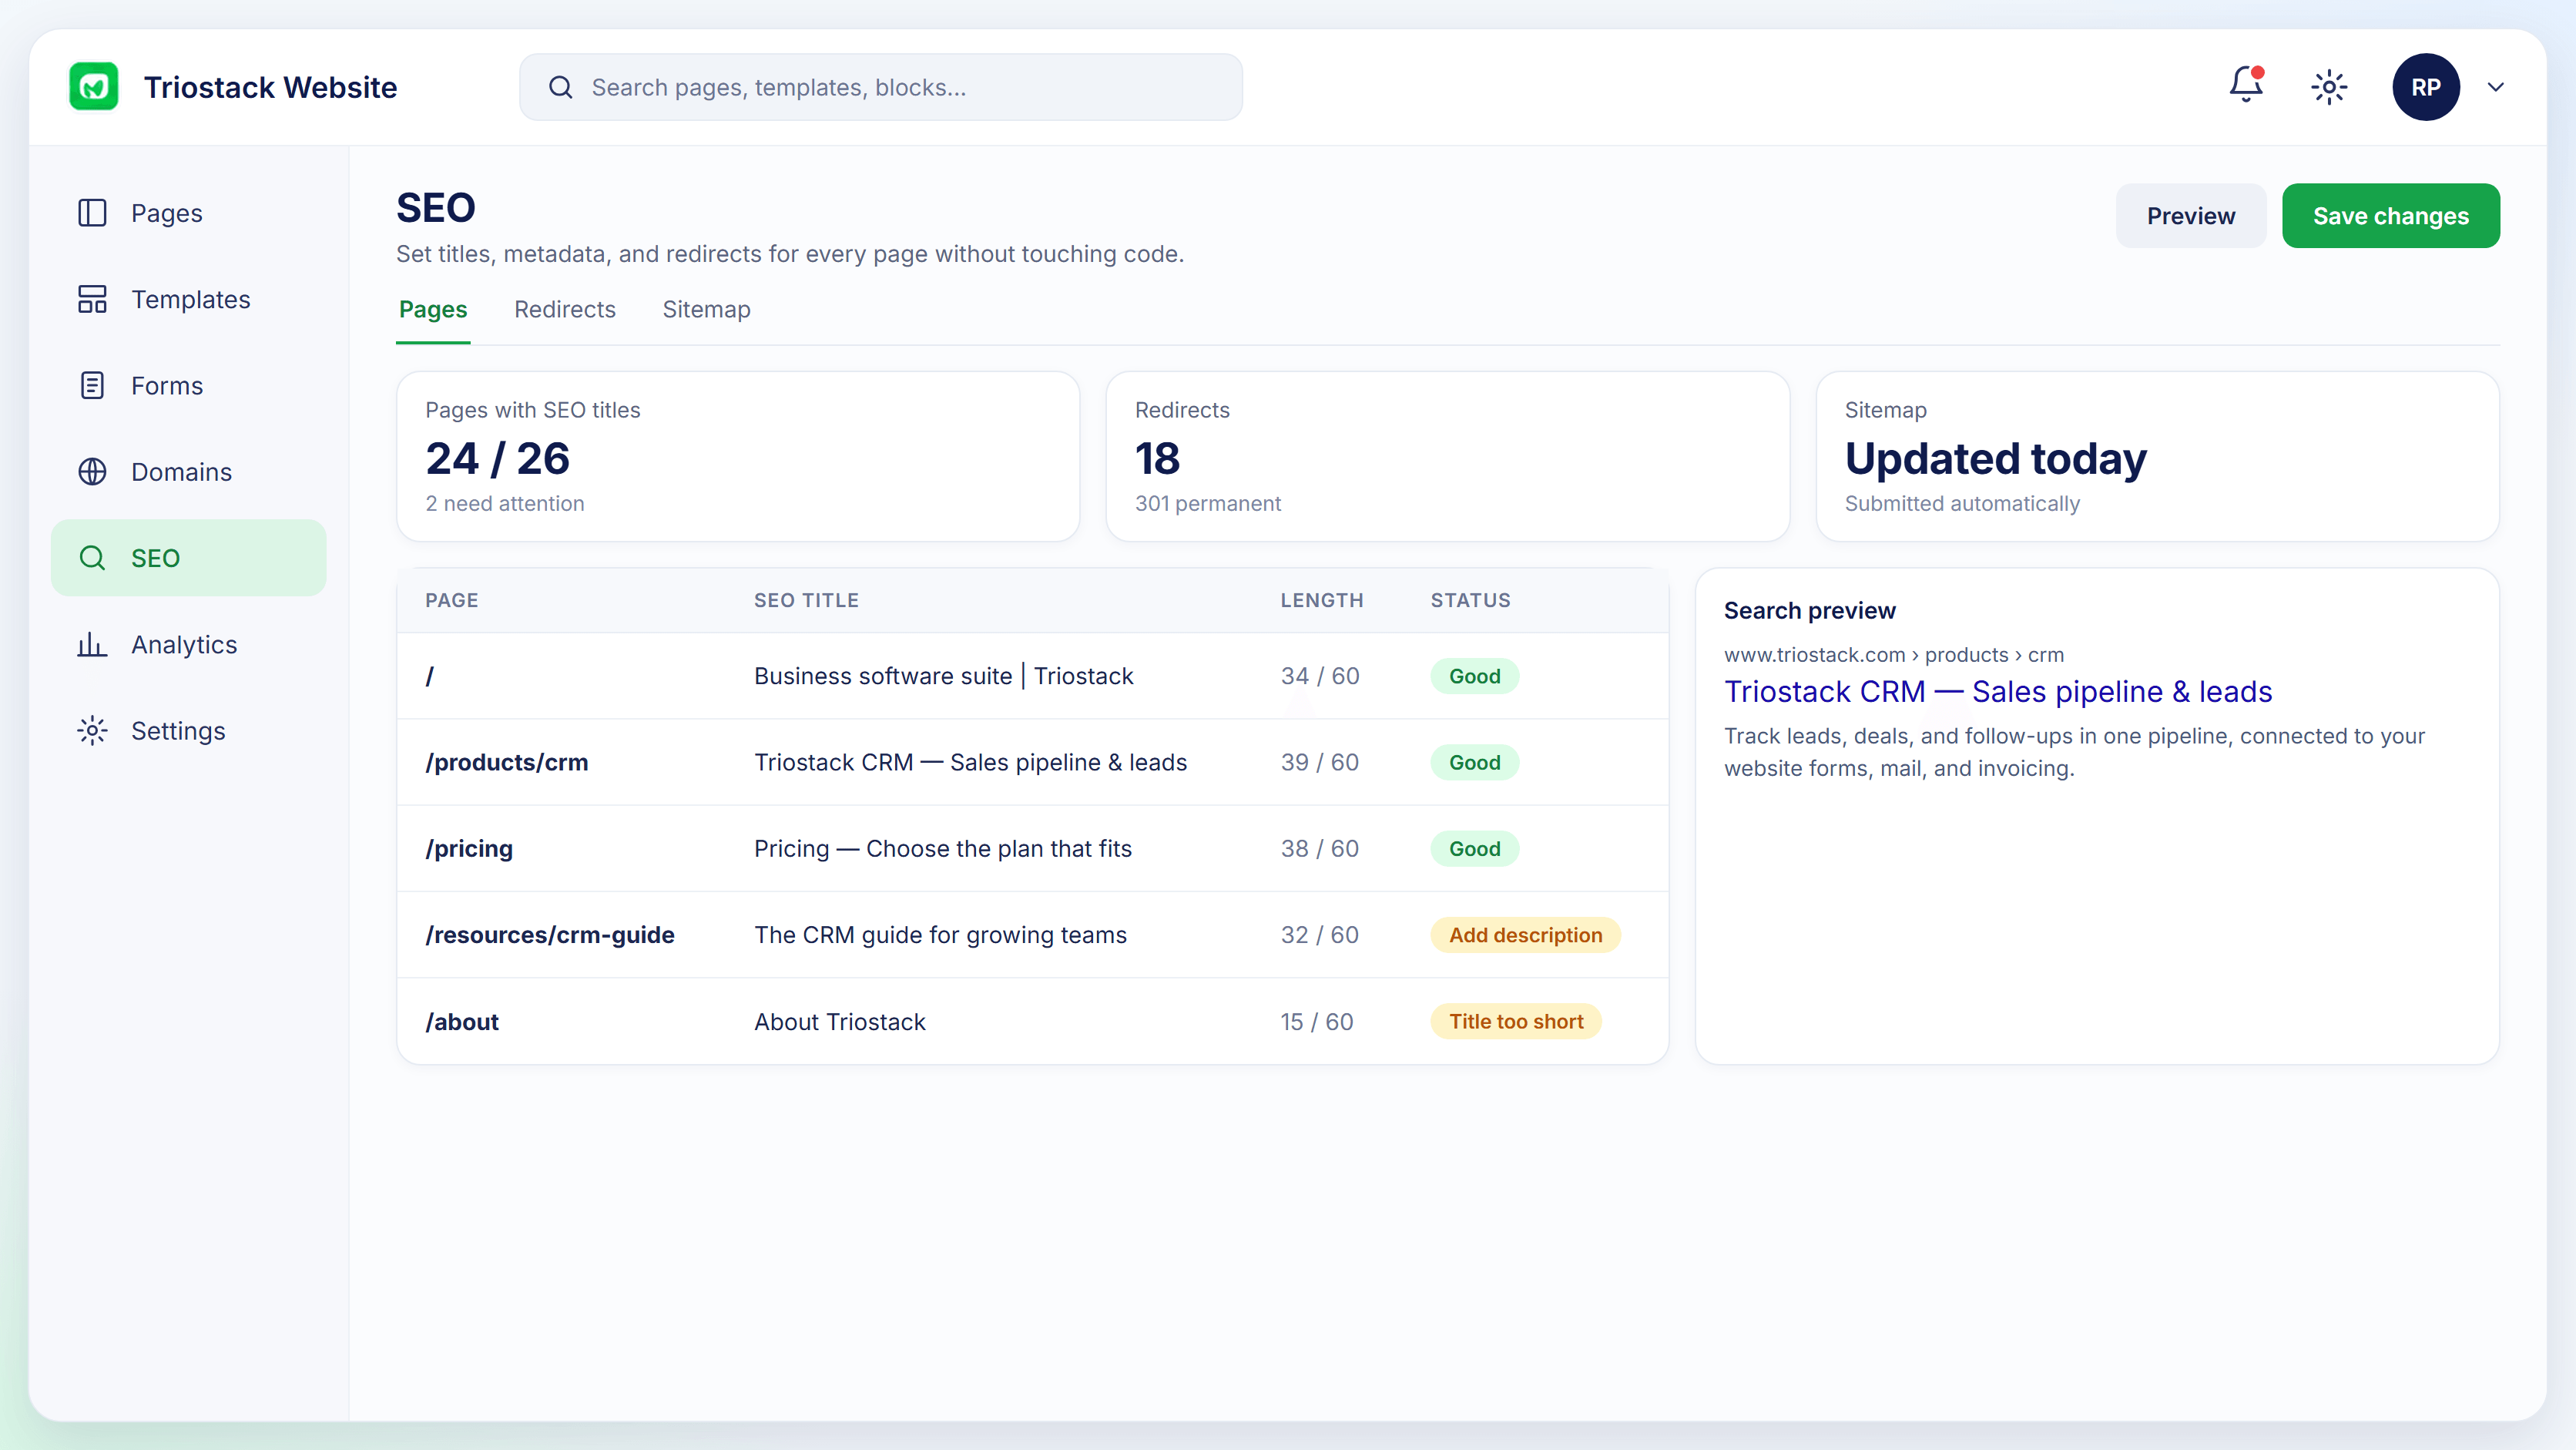
Improve what ranks.
How it fits the plan
Rank. Find your top pages.
Act. Improve or promote them.
Watch out for
Checking the dashboard only after a campaign has ended.
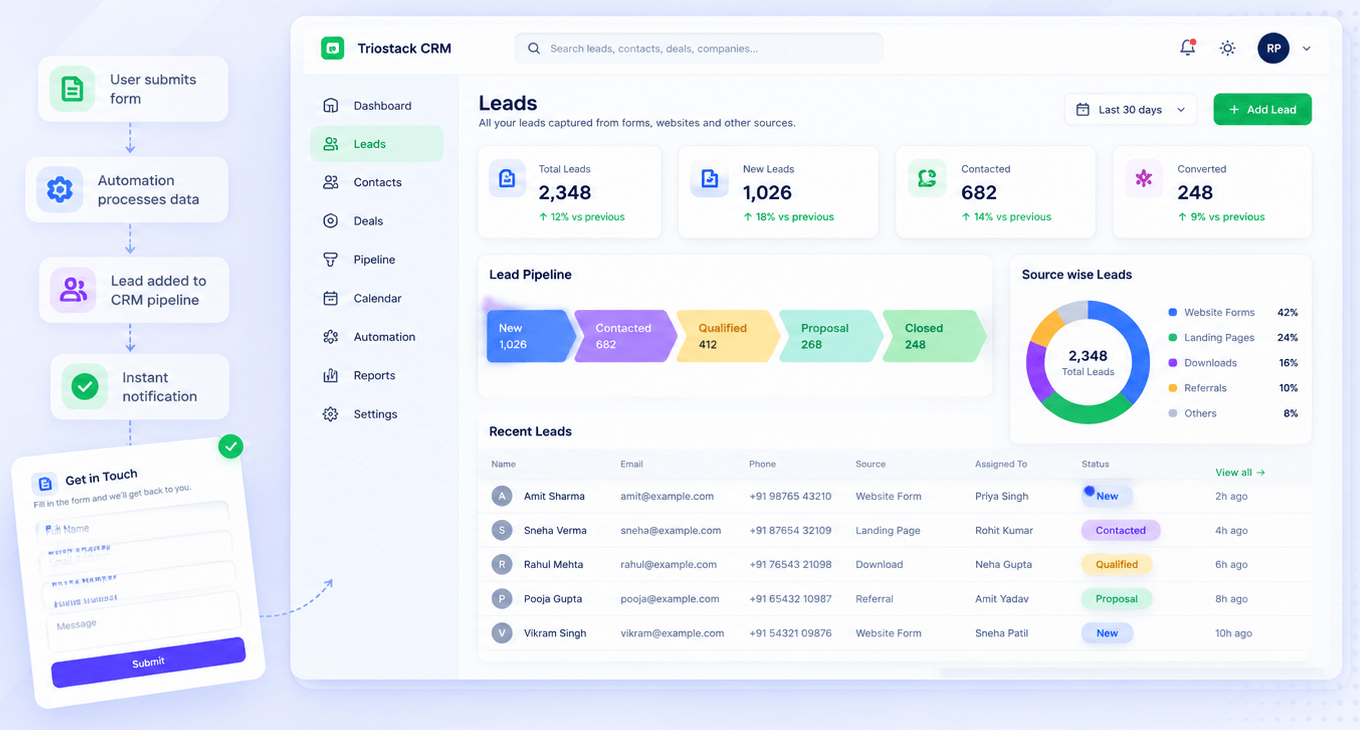
Follow the lead.
How it fits the plan
Act. Improve or promote them.
Open. See the headline numbers.
Before you start
Execution Plan
See the headline numbers.
Look at sources and devices.
Find your top pages.
Improve or promote them.
Practical Guide
Before you start
A tip that helps
Look at conversion, not just visits. A smaller page that converts beats a popular one that does not.
A common mistake
Checking the dashboard only after a campaign has ended.
In Real Life
Scenario 01
Spend goes where leads come from.
Scenario 02
A weak page is rebuilt.
Scenario 03
The team reads one dashboard.
Straight answers about Analytics, from setup to what happens next.
Have a question about Analytics?
Book a free callVisitors, form submissions, form conversion, average time on page, sources, devices and top pages.
Yes, visits and submissions over time.
By visits, submissions and conversion rate.
Ask us about tracking integrations on your plan.
Follow visitors, form submissions, form conversion and average time on page, with traffic by source and device and your top pages ranked.
It runs in 4 steps: Open, Compare, Rank and Act. See the headline numbers.
The real screens on this page include Forms, SEO Controls, Drag-and-Drop Editor and Site Analytics, all captured from the product.
Request a demo or start a free trial. Our team can also walk you through a guided setup, so your first session ends with something working.
Keep Exploring
Pages, forms, SEO and hosting in one workspace, with every form submission landing in your CRM.
Explore All Website Features