The best Business Suite software in India, built to help your business grow. Contact us at +91-8882435276.
[ Contact ]
Phone number
Email address
Head office
Noida office
The right team at TriostackOne will get back to you.
Positioning Assessment
Setting up analytics often means adding scripts, waiting for data and hoping nothing was missed.
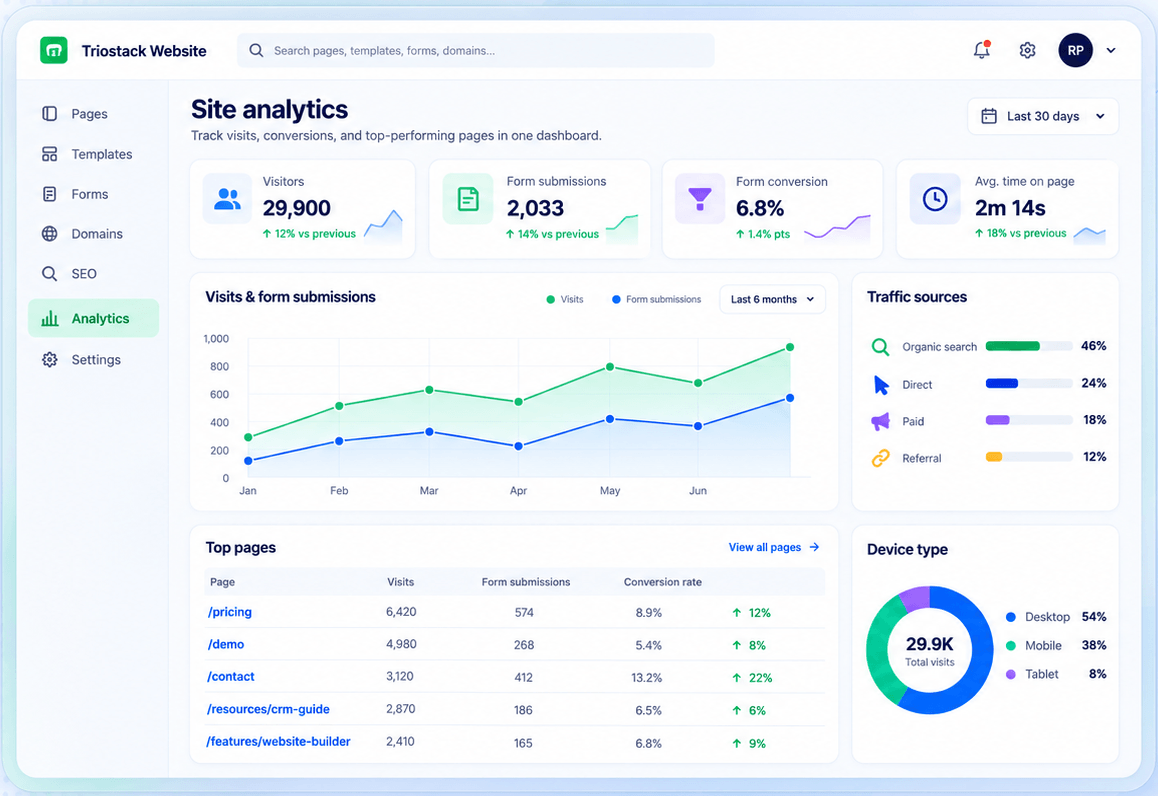
Triostack Website has an analytics dashboard built in: visitors, form submissions, form conversion, average time on page, traffic sources and devices, and top pages. Ask us about adding third-party analytics or tracking pixels on your plan.
“The built-in dashboard answered our first ten questions before we added anything else.”
Sample team scenario
Illustrative example, not a customer testimonial
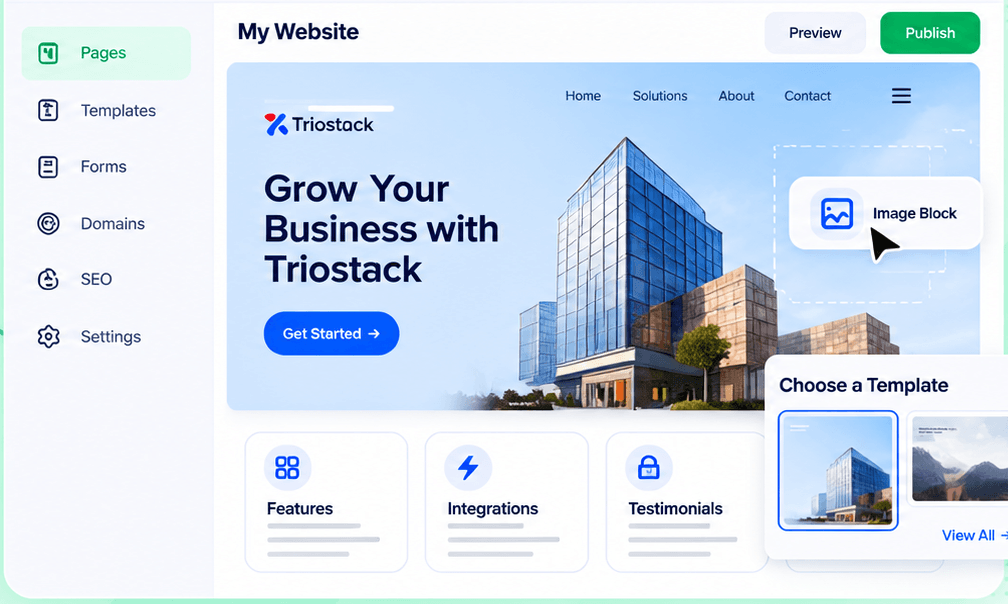
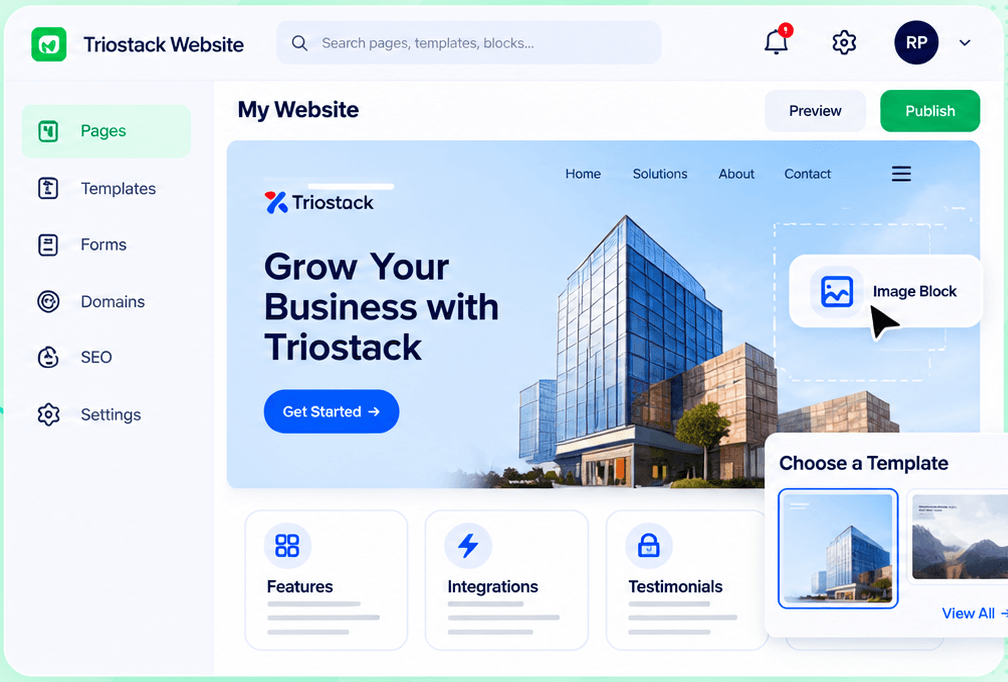
Drag-and-Drop Editor
Build a page visually and publish when it is ready
In the Product
Imagine a car that comes with its dials working, and a spare socket for more.
No setup.
Sources, devices and pages.
Ask about tags.
Platform Integrity
No script to install
Where traffic comes from
Forms tied to visits
Ask what your plan allows
How It Works
What changes when reporting is native.
| Dimension | Triostack Website | Add-On Tracking |
|---|---|---|
| Setup | None | Install and verify |
| Forms | Conversion included | Configure events |
| Sources | Source and device | Depends on tool |
| Custom tags | Ask us about your plan | Full control |
| Ownership | Same workspace | Separate login |
Our team can walk you through the connection, permissions and a first test so your website fits into the tools your team already uses.
Live Interface Tour
Real screens captured directly from the Triostack Website workspace.
Site Analytics
Visitors and conversions without extra setup
Feature Breakdown
Captured from the Triostack Website workspace.
01
IntegrationsThe dashboard.
How it fits the plan
Publish. Go live; data starts flowing.
Review. Open the analytics dashboard.
Practical tip
Check the built-in dashboard for a fortnight before adding extra tags. You may not need them.
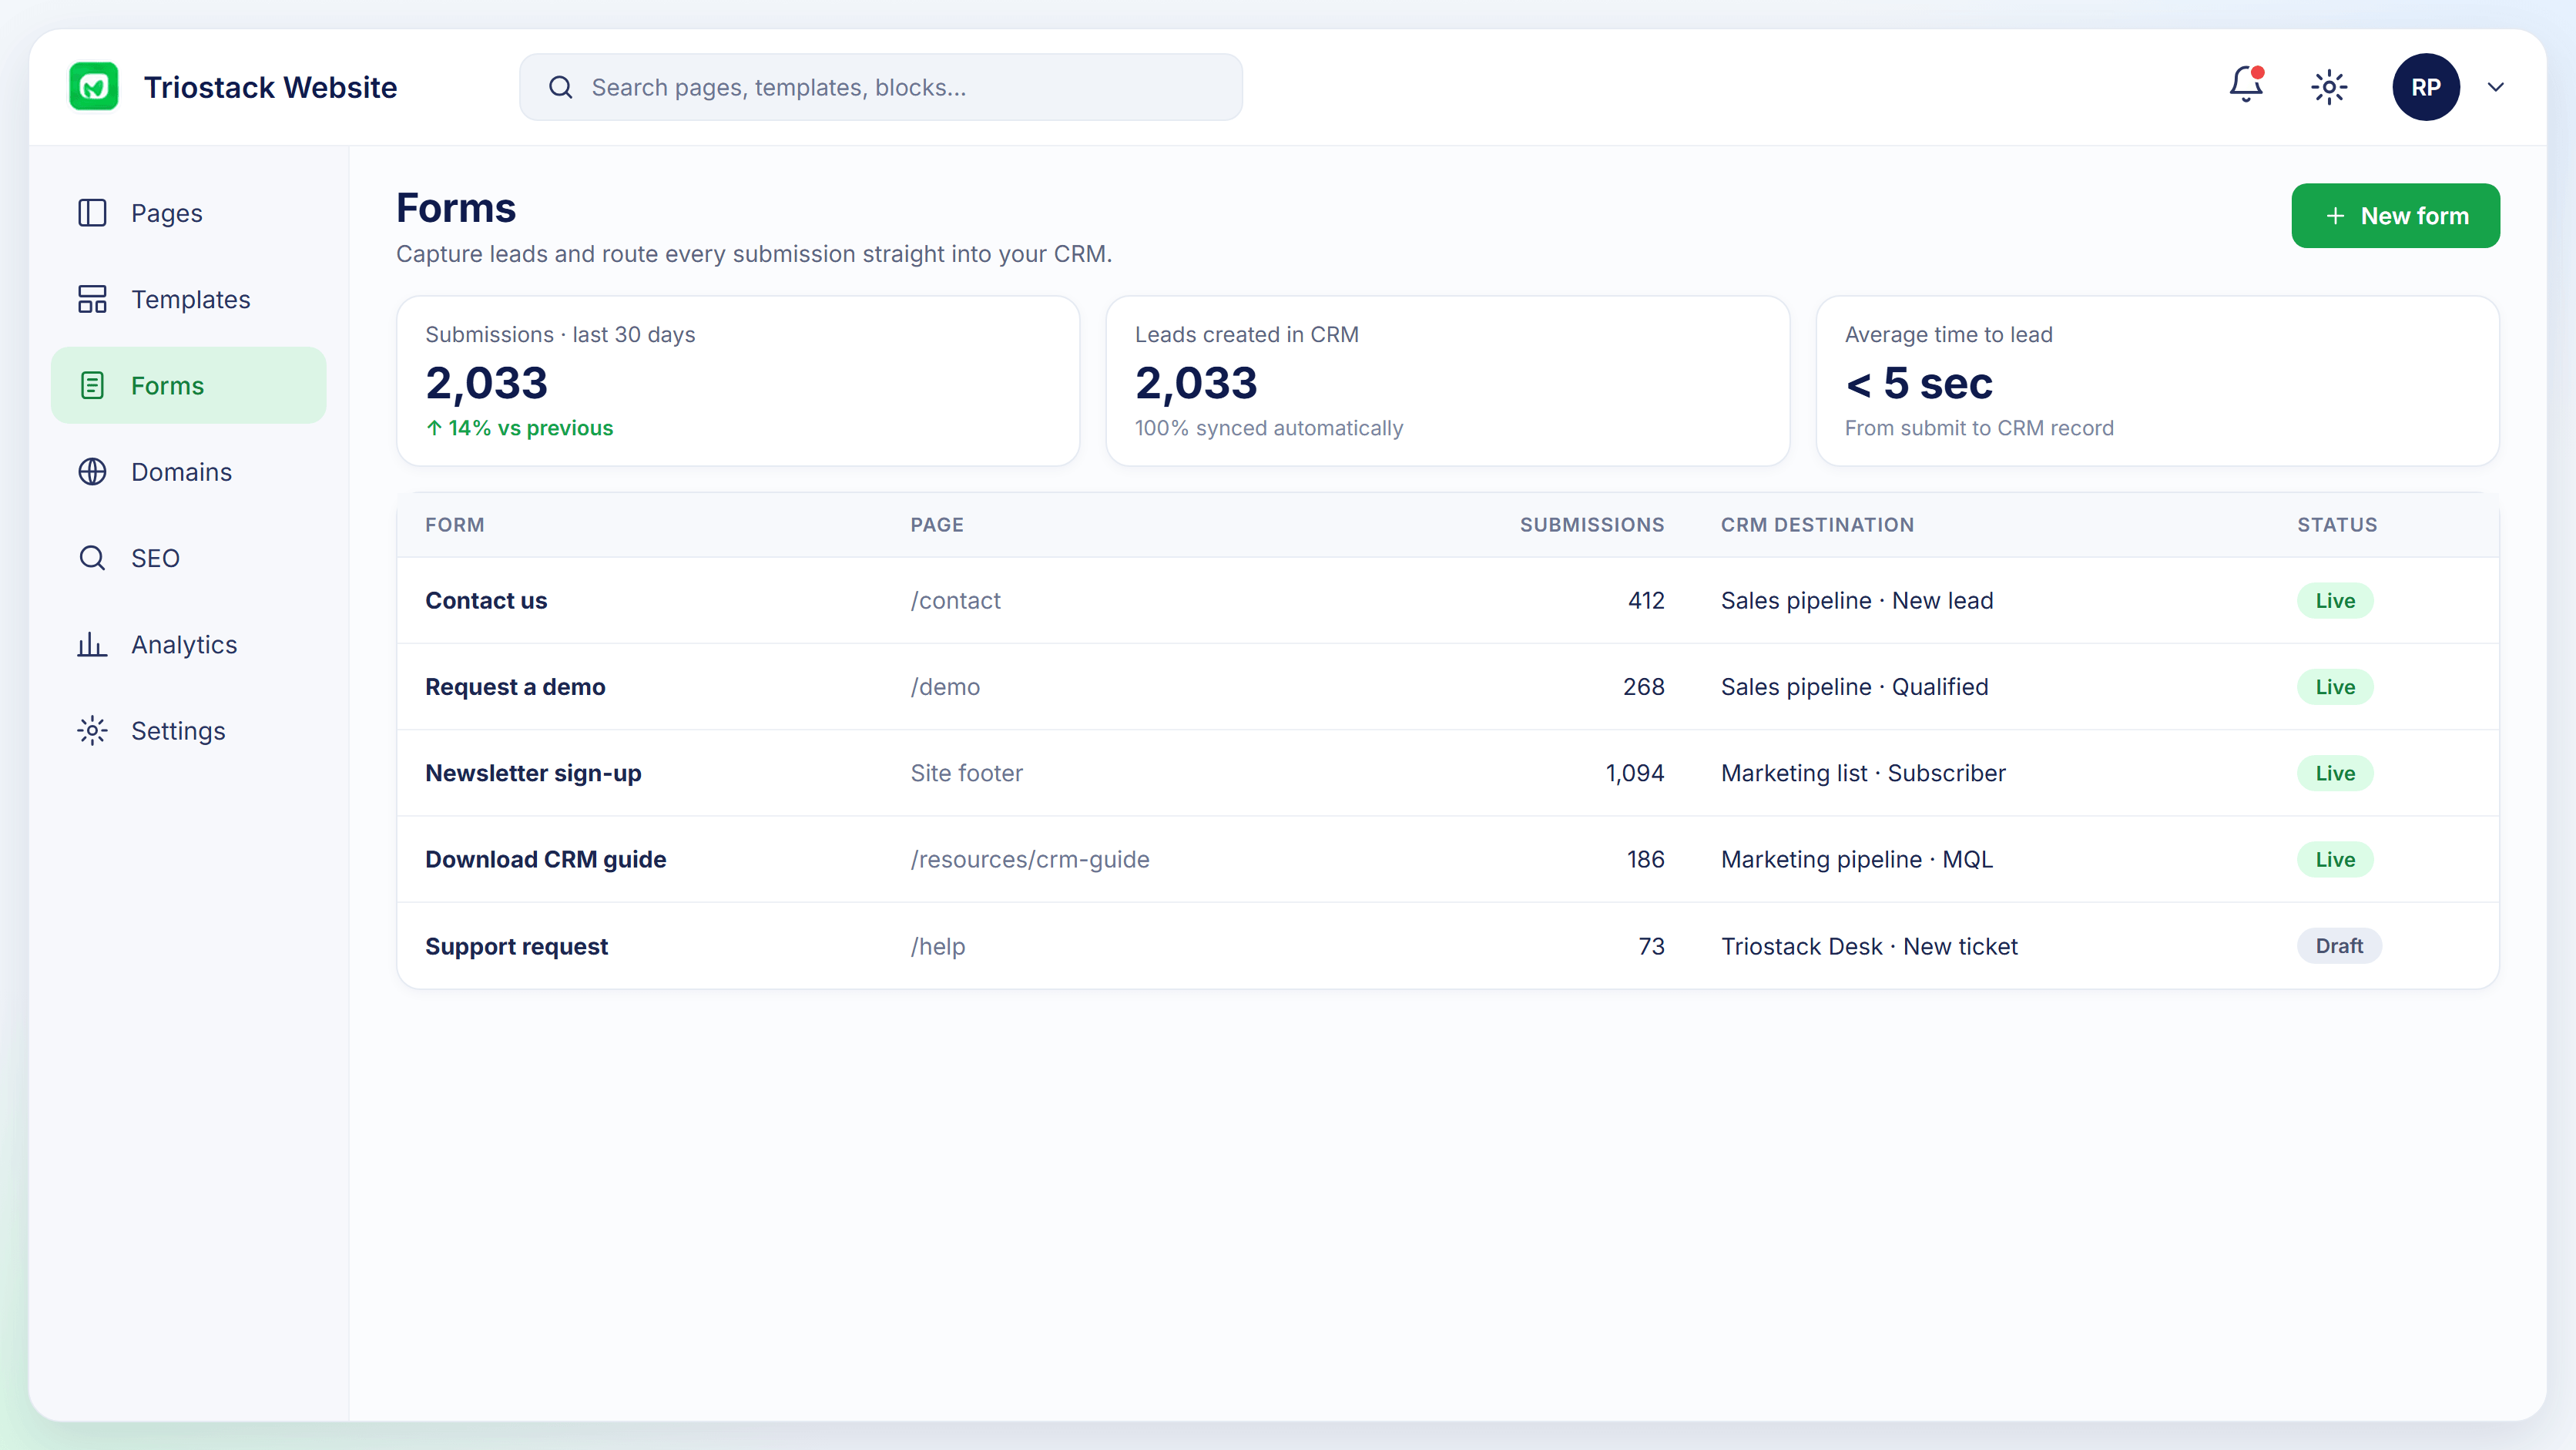
02
IntegrationsConversion by form.
How it fits the plan
Review. Open the analytics dashboard.
Extend. Ask about third-party tags.
In real life
Launch week
Traffic and leads are visible at once.
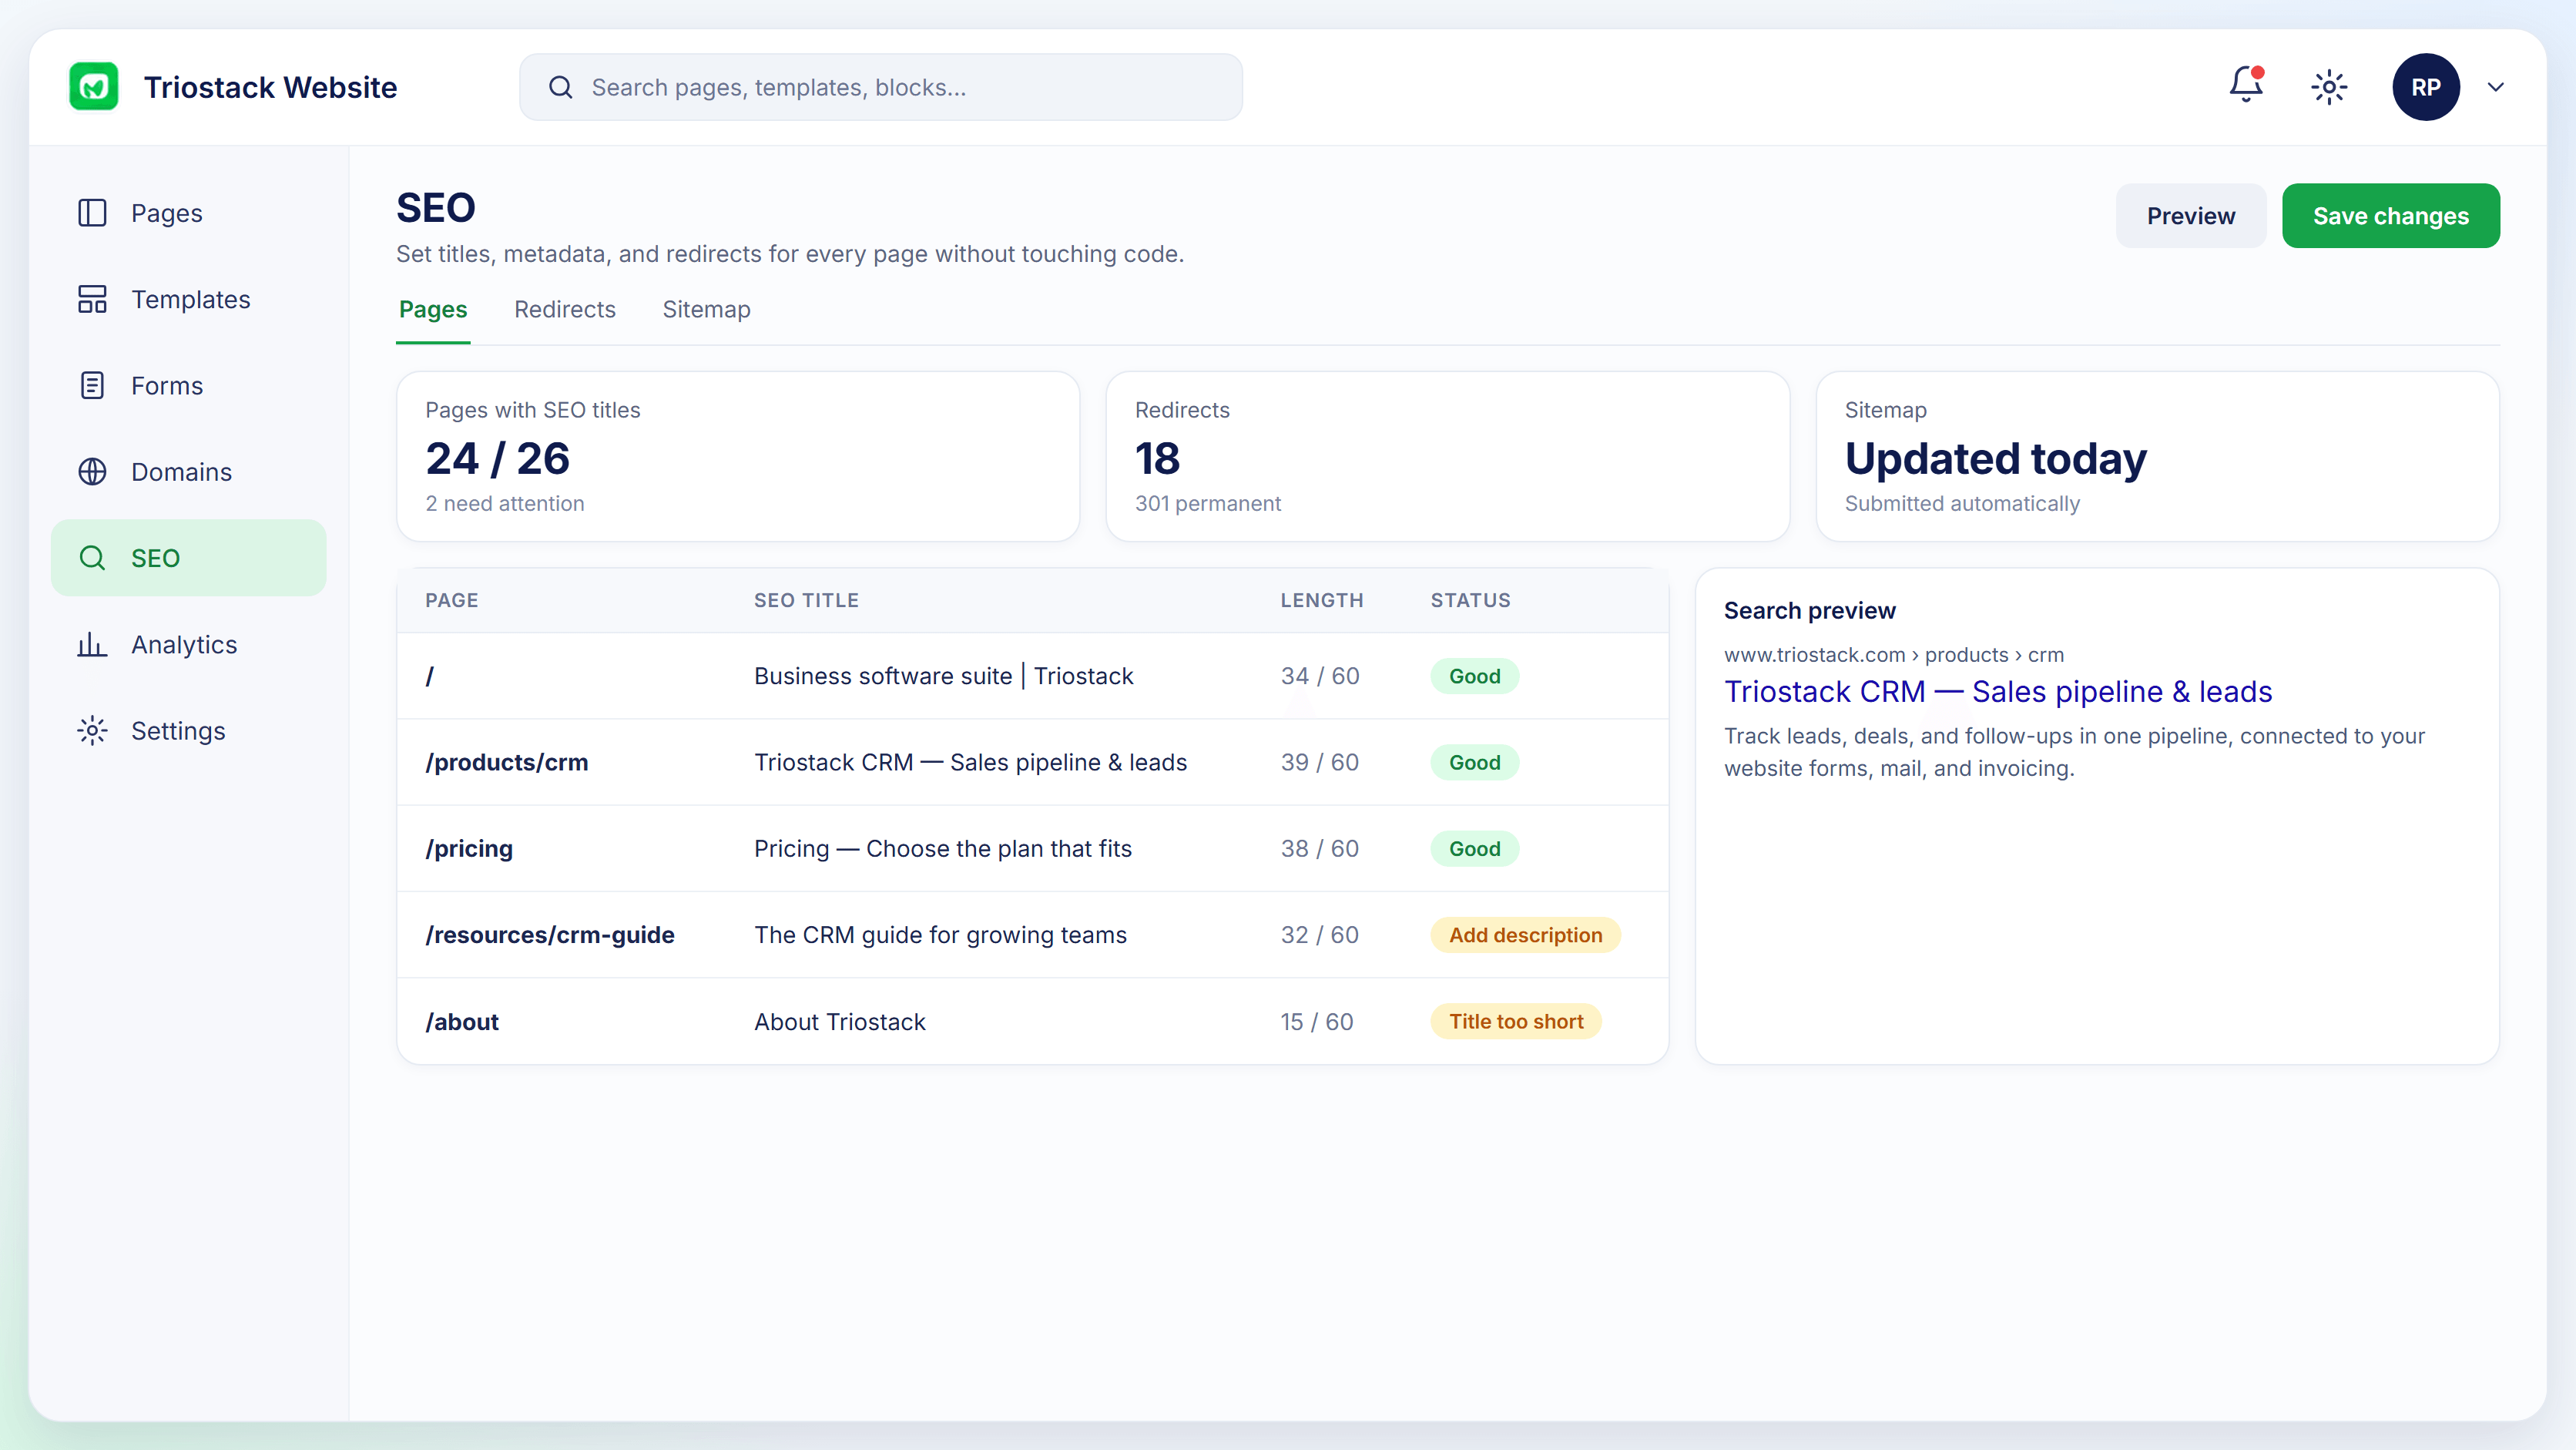
03
IntegrationsFix what ranks.
How it fits the plan
Extend. Ask about third-party tags.
Compare. Check results against campaigns.
Watch out for
Adding several tracking scripts at once, then not knowing which is slowing the page.
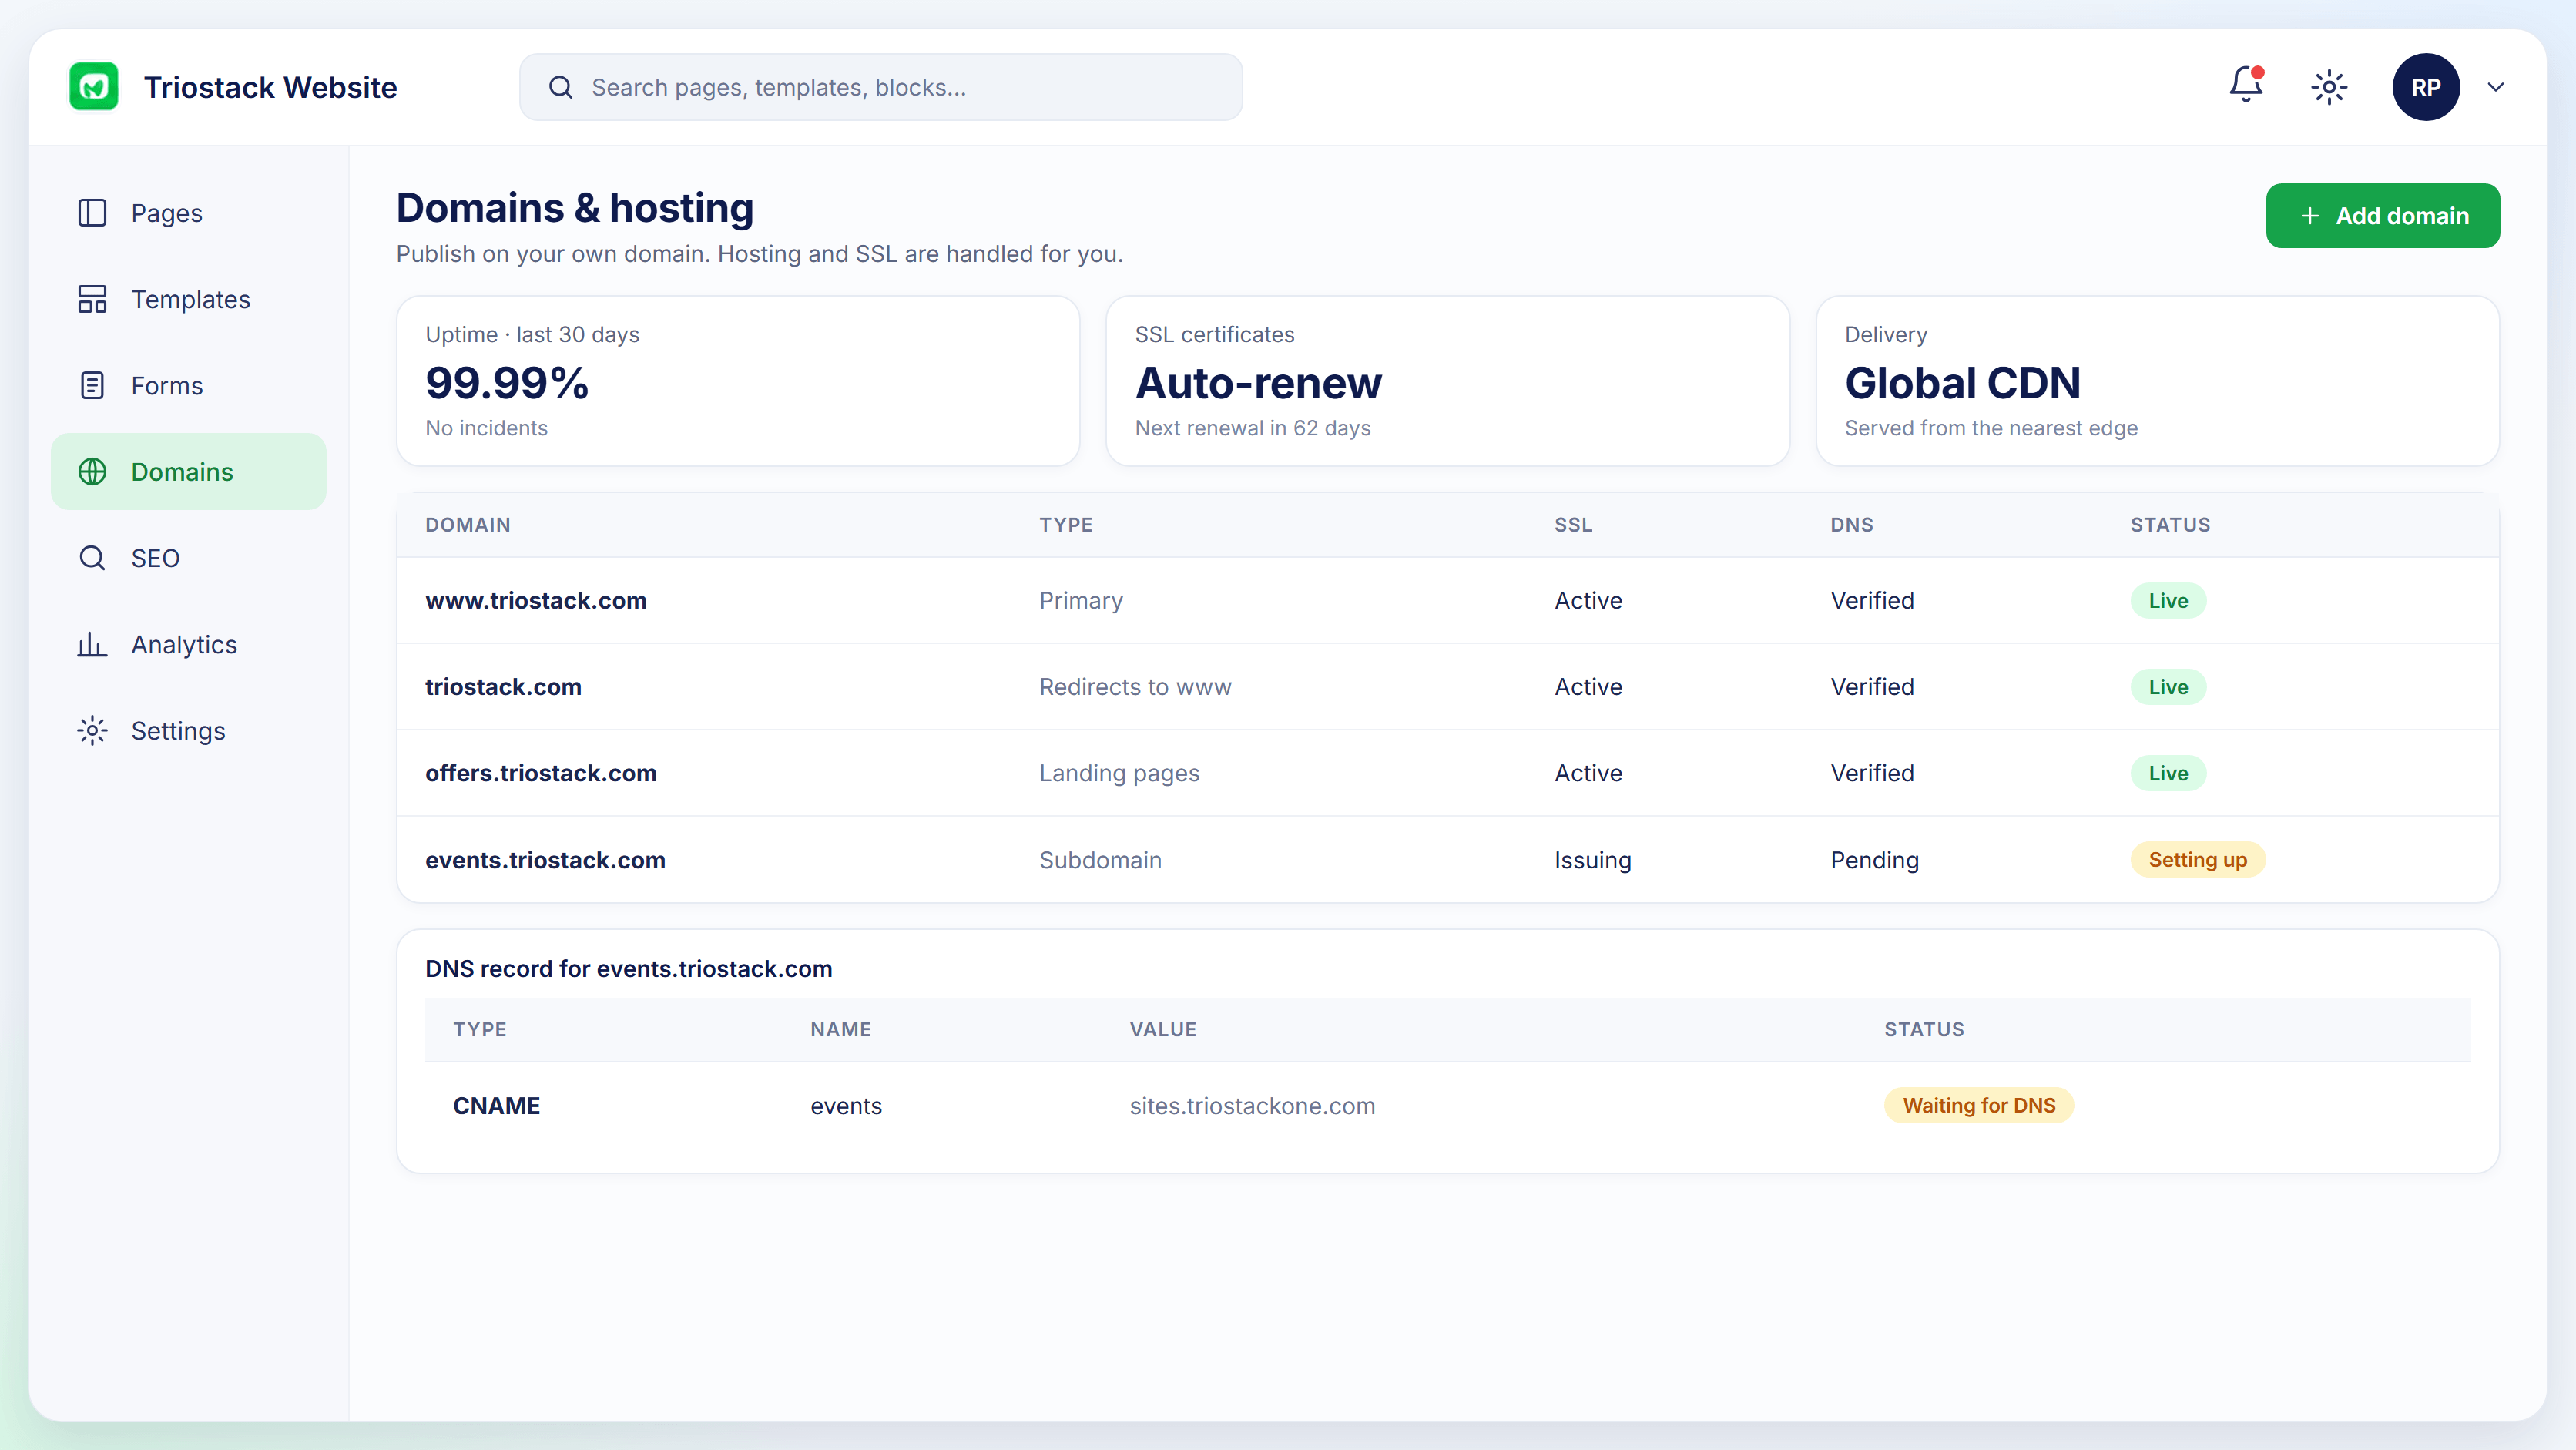
04
IntegrationsWhat is live.
How it fits the plan
Compare. Check results against campaigns.
Publish. Go live; data starts flowing.
Before you start
Execution Plan
Go live; data starts flowing.
Open the analytics dashboard.
Ask about third-party tags.
Check results against campaigns.
Practical Guide
Before you start
A tip that helps
Check the built-in dashboard for a fortnight before adding extra tags. You may not need them.
A common mistake
Adding several tracking scripts at once, then not knowing which is slowing the page.
In Real Life
Scenario 01
Traffic and leads are visible at once.
Scenario 02
Sources show what is working.
Scenario 03
Your team adds a pixel with our guidance.
Straight answers about Analytics & Tracking, from setup to what happens next.
Have a question about Analytics & Tracking?
Book a free callYes. It shows visitors, submissions, conversion, sources and devices.
Ask us what your plan supports.
Yes, by form and by page.
Ask us about tag setup.
Use the built-in dashboard for visitors, submissions and conversion, and ask us about adding third-party analytics or tracking tags.
It runs in 4 steps: Publish, Review, Extend and Compare. Go live; data starts flowing.
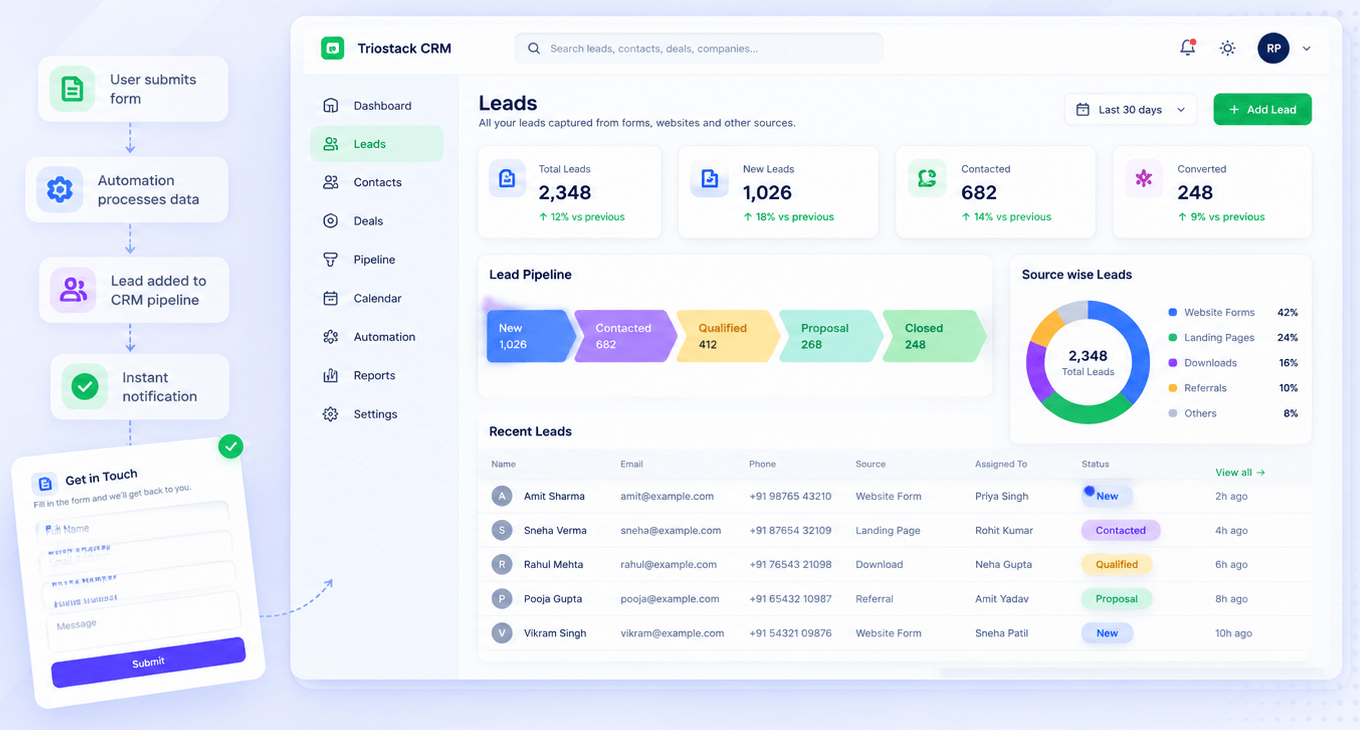
The real screens on this page include Drag-and-Drop Editor, Form-to-CRM Automation, SEO Controls and Site Analytics, all captured from the product.
Request a demo or start a free trial. Our team can also walk you through a guided setup, so your first session ends with something working.
Keep Exploring
Pages, forms, SEO and hosting in one workspace, with every form submission landing in your CRM.